KPI Scorecard Generator
Show several metrics at once with trends. Export as PNG, SVG, GIF or MP4.
Free to try · No design skills · Ready in about two minutes
Trusted by 1,198 users, including people at
 ByteDance
 Arizona State
 Fox
Fox UT Austin
 Roche
Roche Tulane
 United Airlines
 Clemson
 NHS
NHS Ayming
 Marquette
 Kent State
 Ray White
 UC Riverside
 CBA
CBA Illinois Tech
 Venngage
 Hofstra
 House of Communication
 IIT Madras
 Sotherly Hotels
 Zenus.ai
Overview
What is a KPI scorecard?
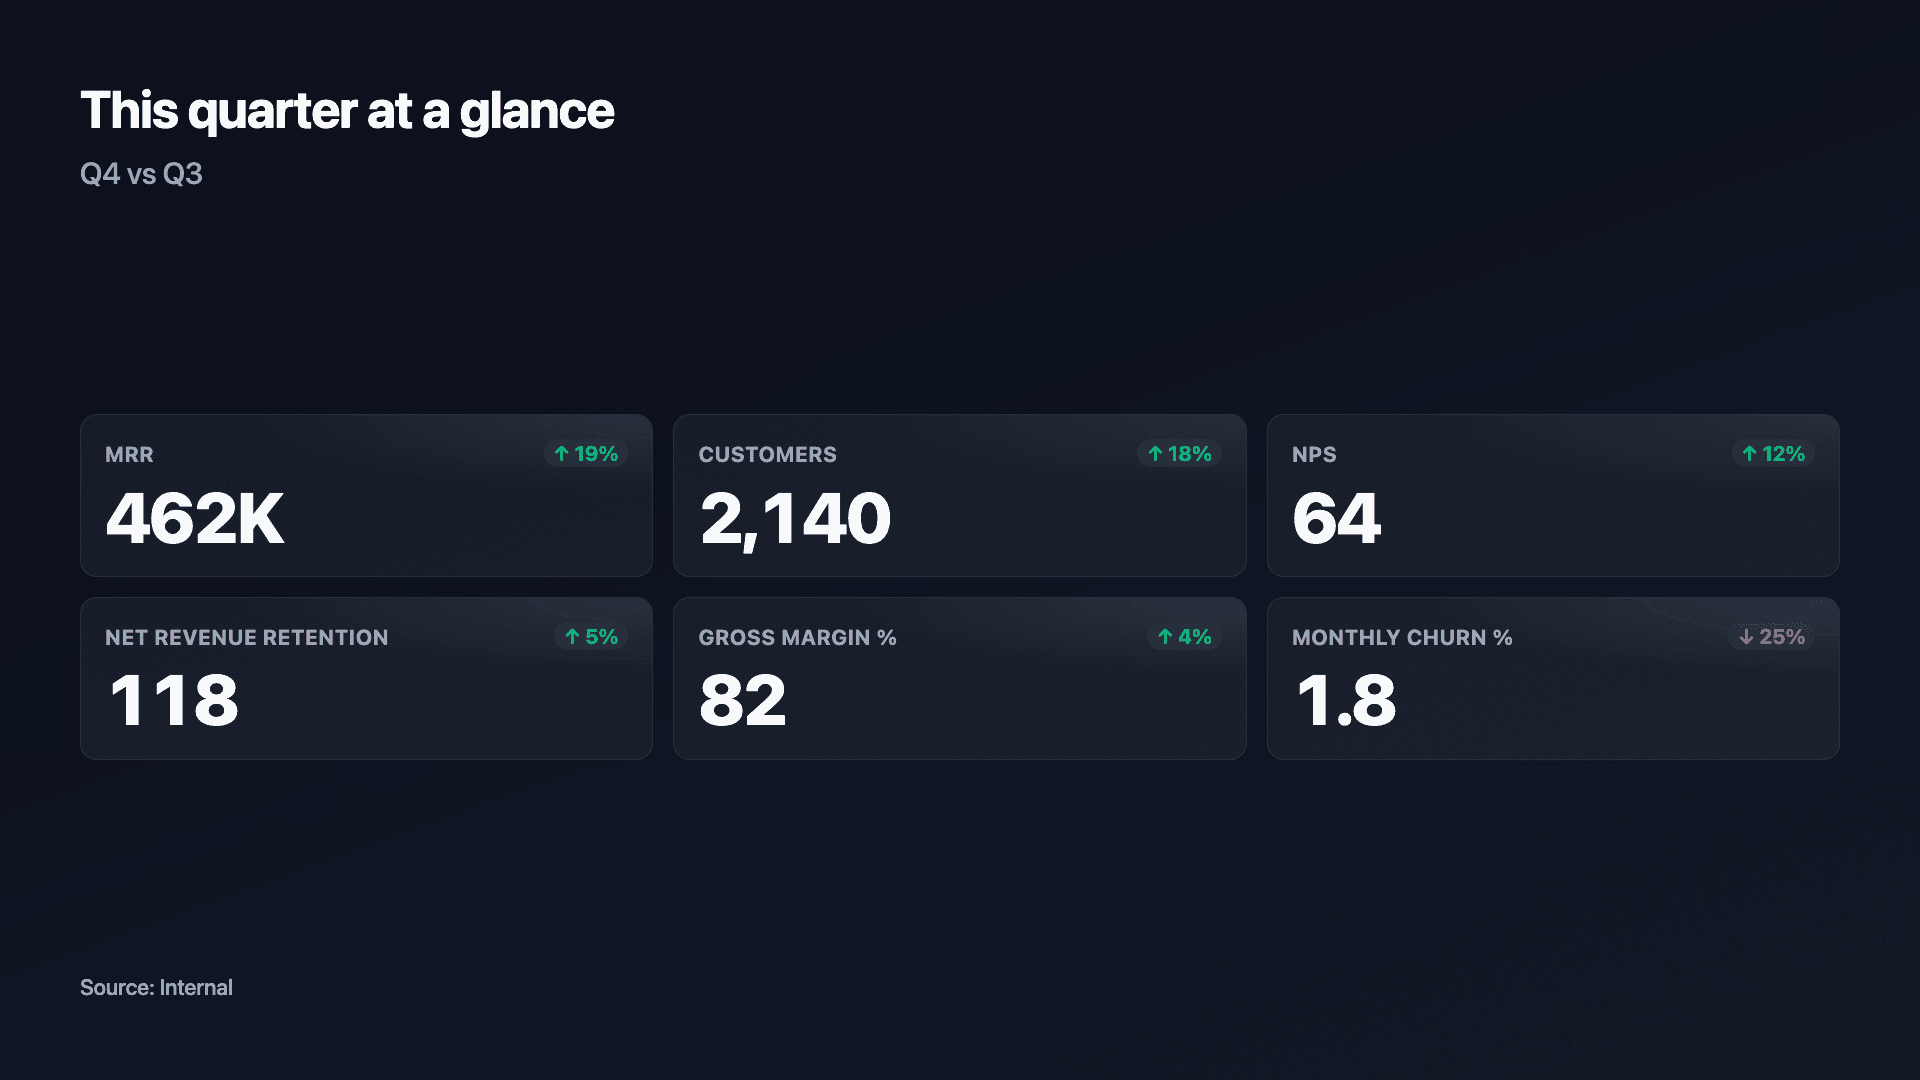
A KPI scorecard presents several headline metrics together, each with its current value and a trend versus the previous period. Where a number counter gives one figure a whole frame, a scorecard packs the four or five numbers that define how things are going into a single, scannable panel. It is the at-a-glance health check.
The trend is what turns a scorecard from a static stat block into a story. A value beside an up or down arrow (and the change versus last period) tells the viewer not just where things stand but which way they are moving, which is the question every investor update, board snapshot and weekly review is really asking.
Reochart animates each metric in and shows the direction against the prior number, so an update feels current and considered. Enter a label, the current value and the previous value for each metric. Export as MP4, GIF, PNG or SVG, with your brand colours on Pro.
How it works
How a KPI scorecard works
Each metric is a tile: a label, the current value, and a previous value used to compute the change. Reochart shows the figure with an up or down trend arrow so the direction reads instantly, and lays the tiles out in a clean grid.
Keep it to a handful of metrics, four to six is the sweet spot. A scorecard is a summary; if every number is on it, none of them stands out.
Examples
Example KPI scorecards
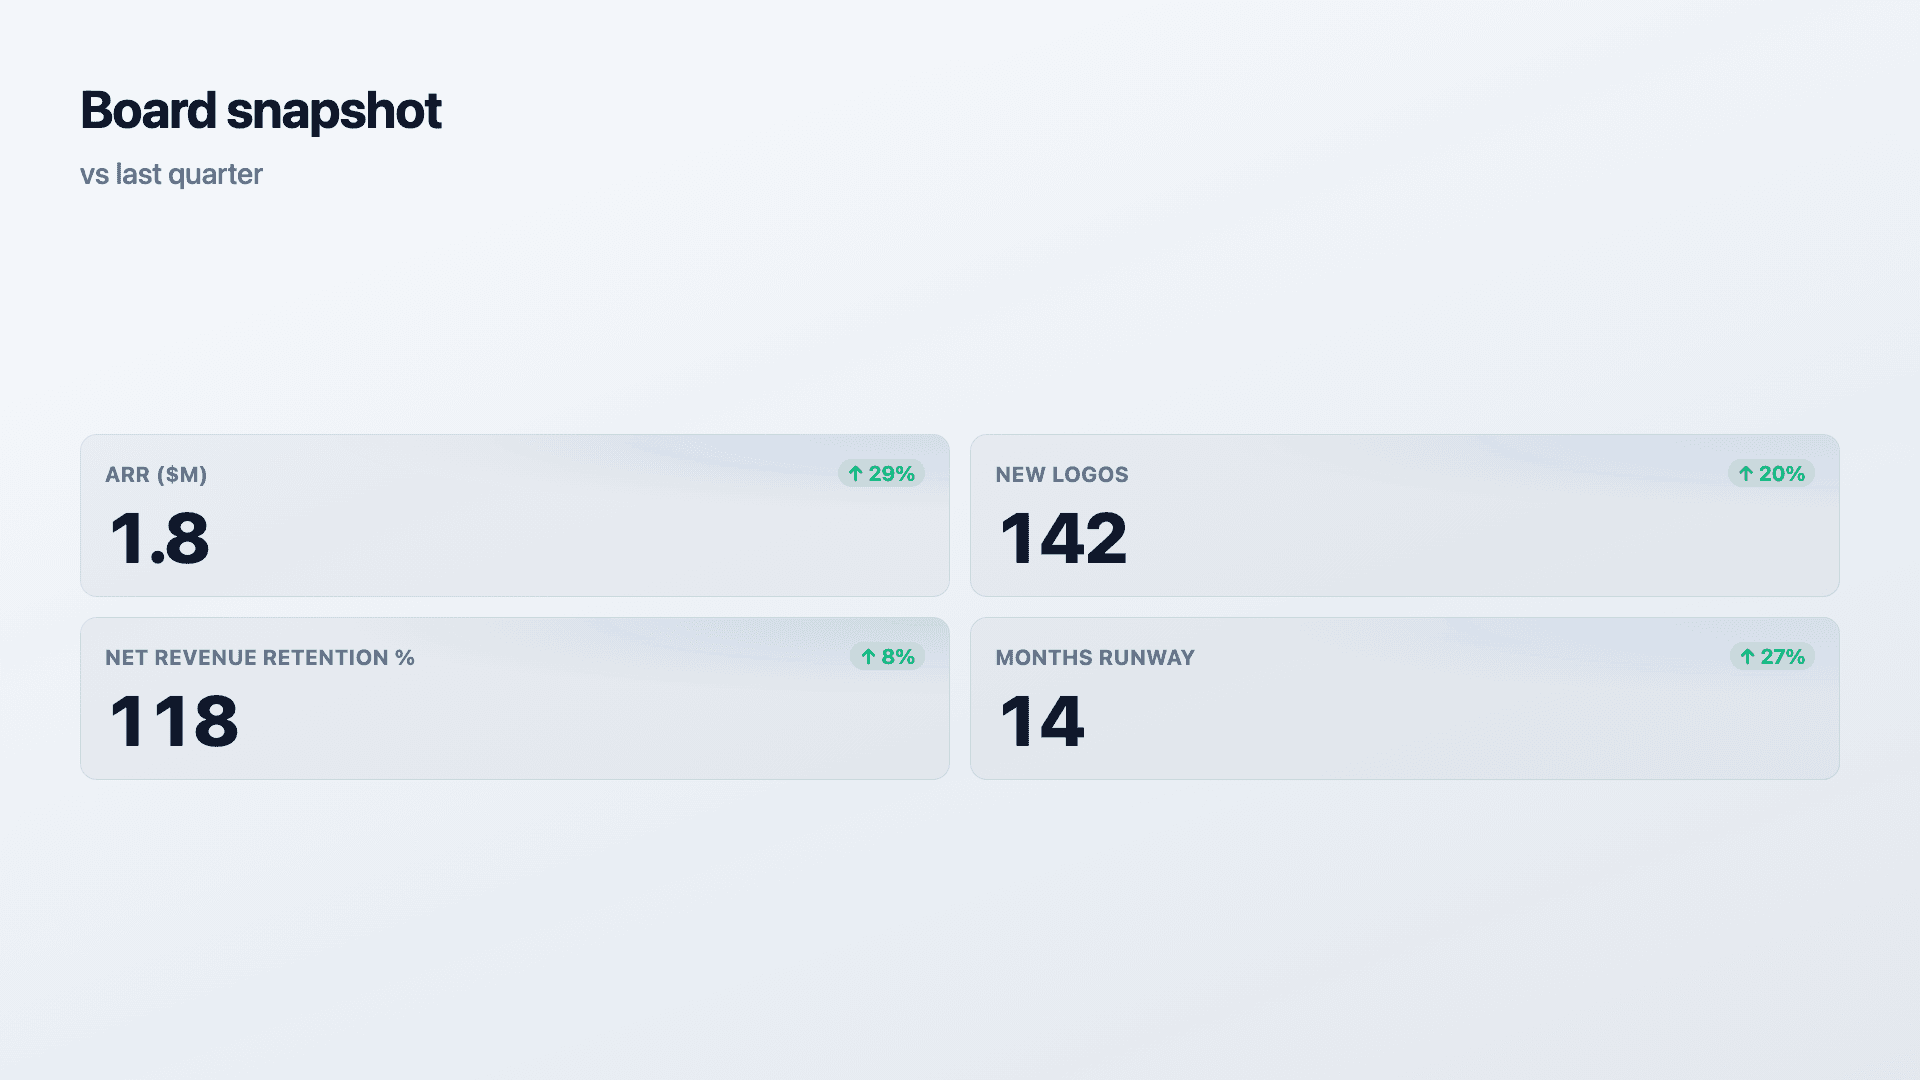
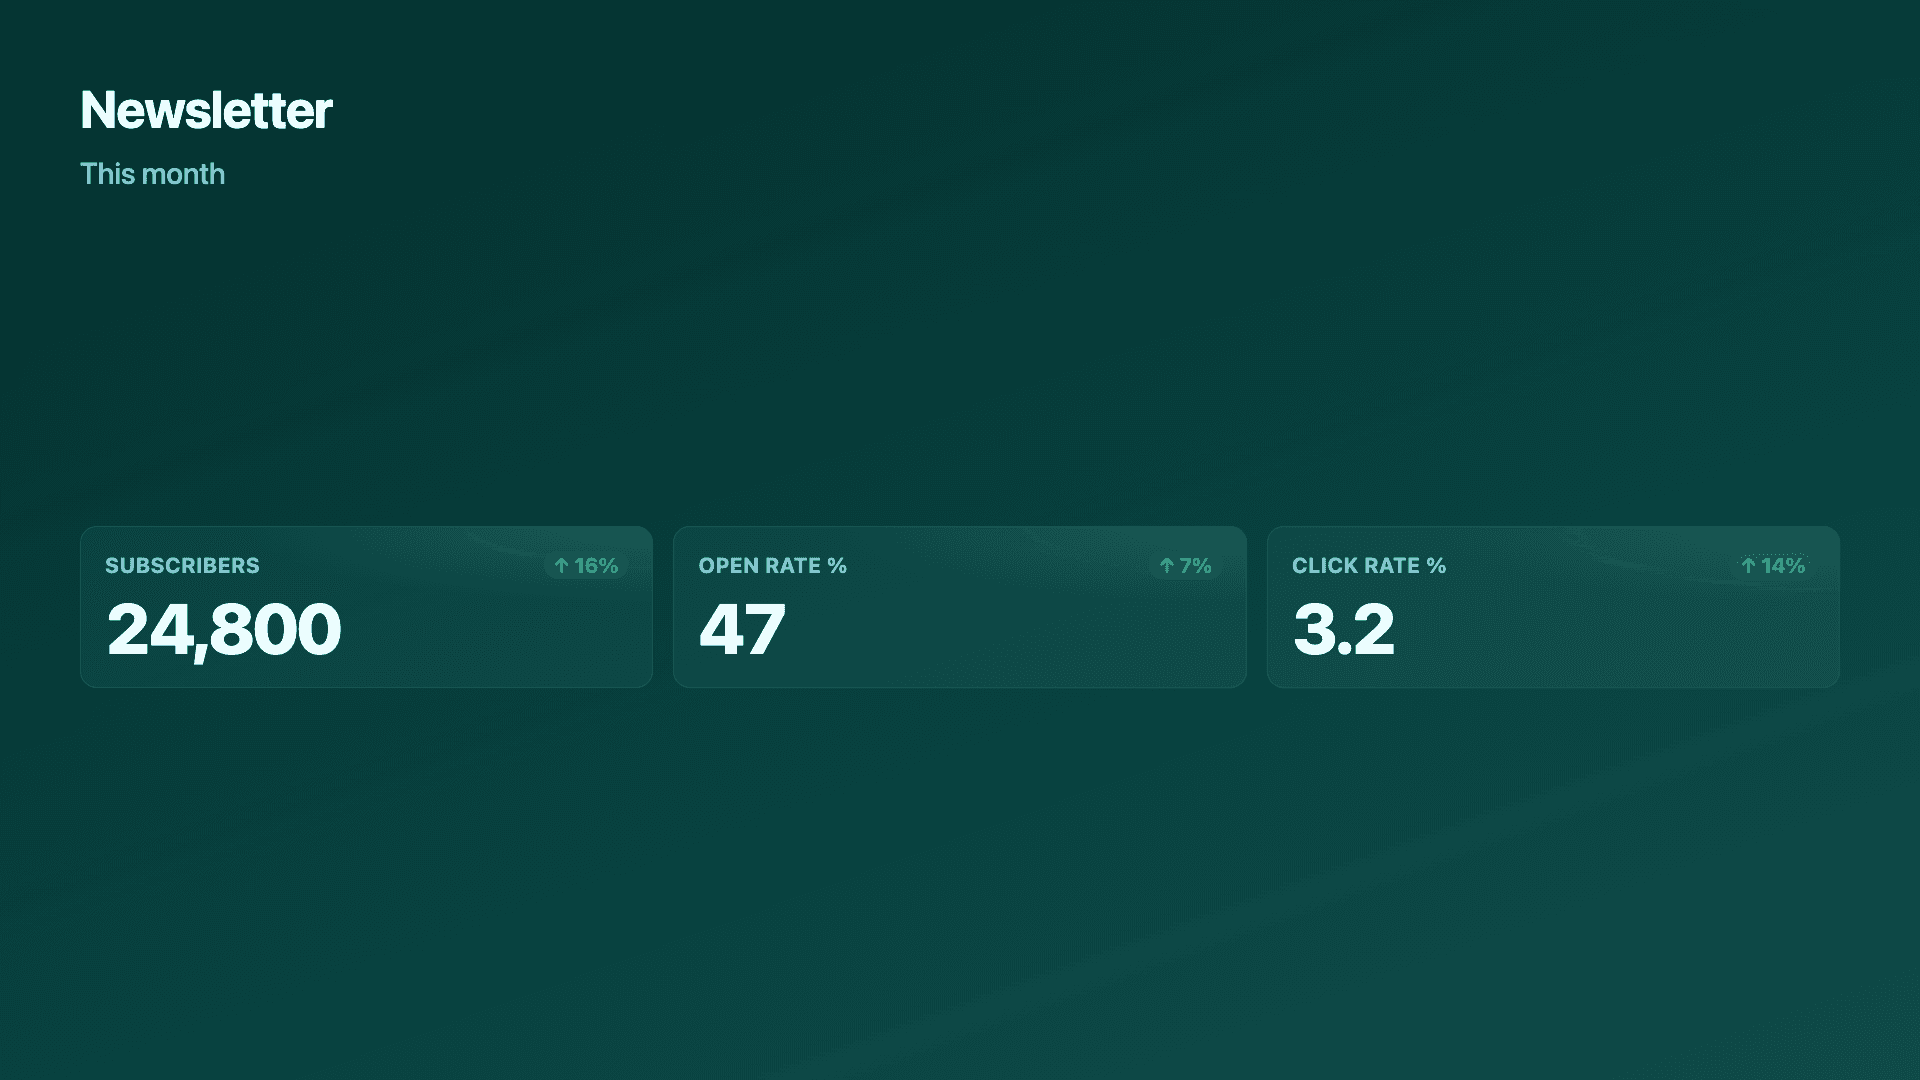
Real charts made in Reochart, each with its own data and theme. They animate automatically as you scroll.
Good fit
When to use a KPI scorecard
- ✓An investor or board update
- ✓A weekly or monthly metrics snapshot
- ✓Newsletter or growth KPIs
- ✓A dashboard summary tile
- ✓Any 'how are we doing' overview
Reach for something else
When not to use a KPI scorecard
- ✕You have one hero figure, use a number counter.
- ✕You need to show a metric's full trend, use a line or area chart.
- ✕You are comparing categories, use a bar chart.
- ✕You have a dozen-plus metrics, a scorecard loses its focus.
- ✕Each metric is measured against a specific target rather than just last period, a bullet chart draws the target as a tick so "did we hit it" reads instantly.
Compare
KPI scorecard vs other charts
KPI scorecard vs the alternatives.
| Visual | Best for | Avoid when |
|---|---|---|
| KPI scorecard | Several metrics with trends | A single hero figure |
| Number counter | One headline number | Several metrics together |
| Line / area | One metric's full trend | A multi-metric snapshot |
| Bar chart | Comparing categories | Tracking KPIs vs last period |
Your data
What data you need
One row per metric: a label, the current value and the previous value (used for the trend arrow). Paste from a sheet or import a CSV.
| Metric | Current | Previous |
|---|---|---|
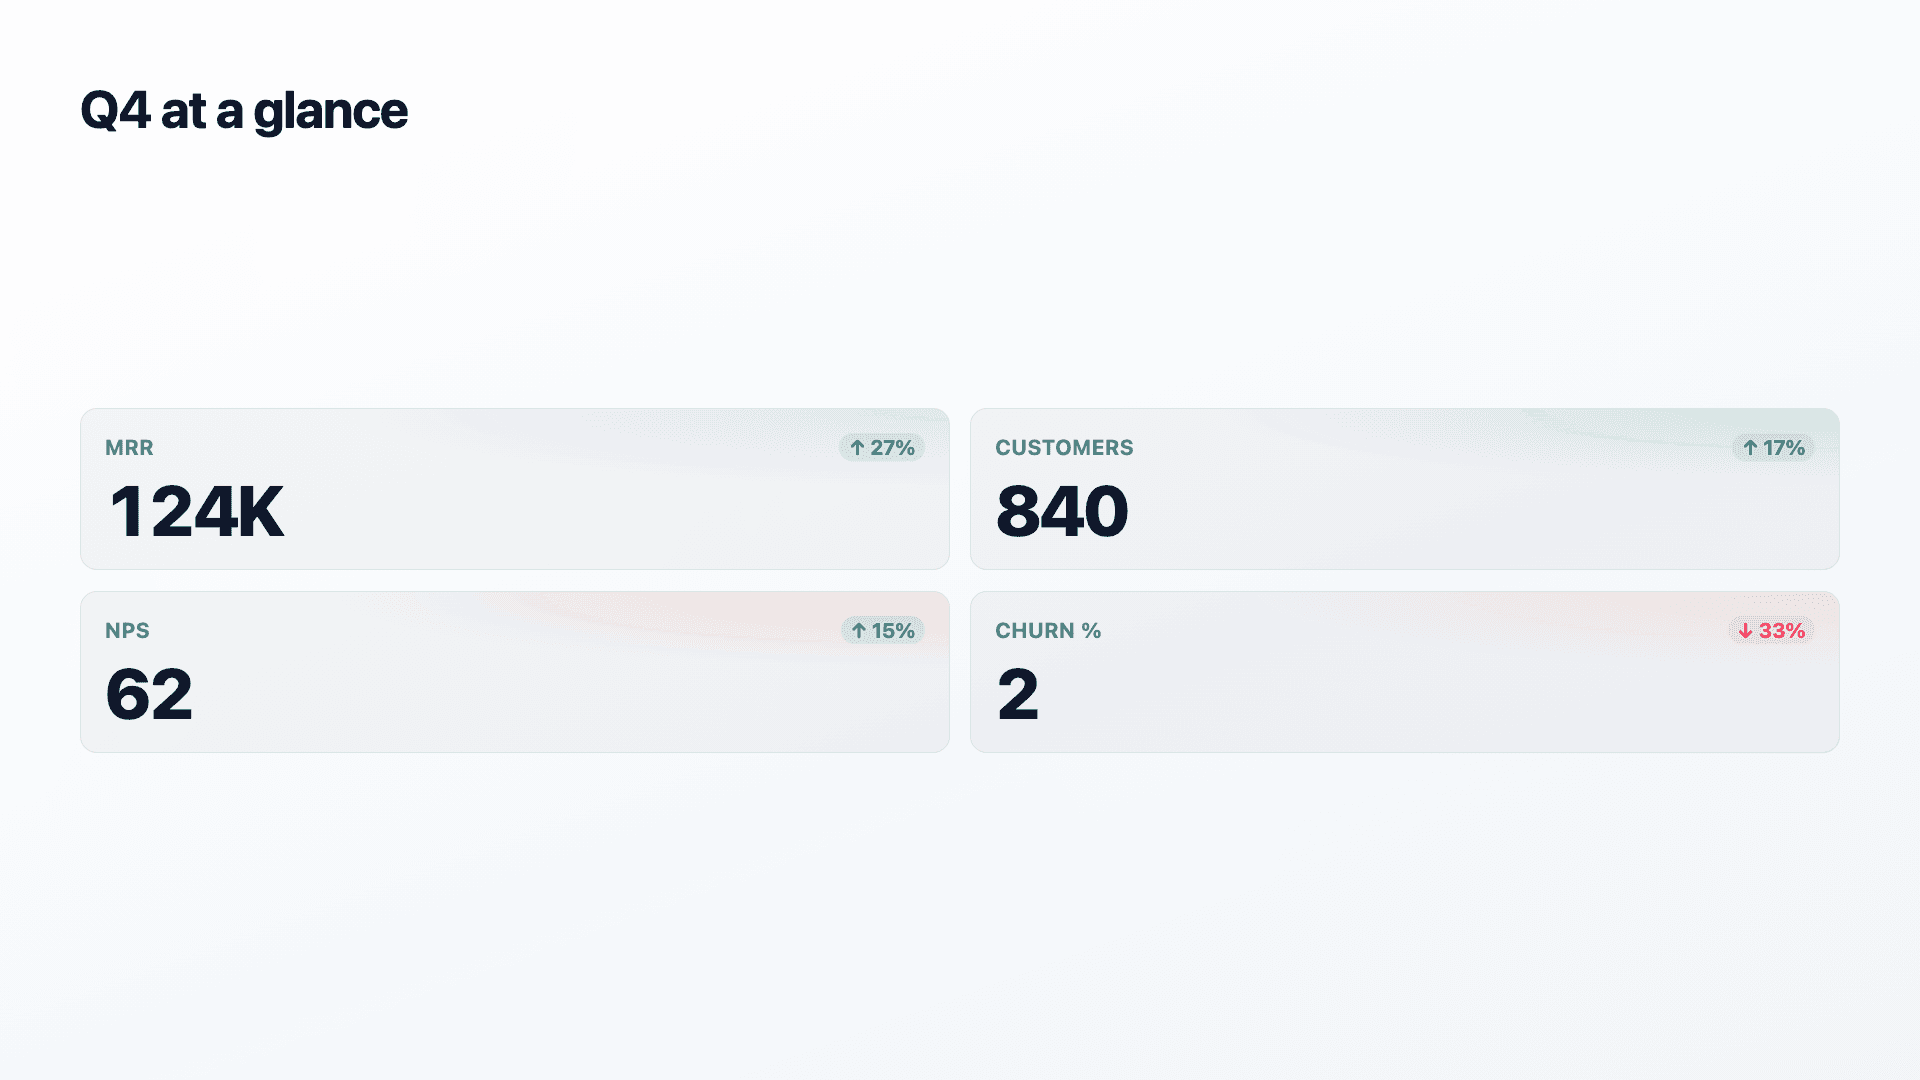
| MRR | 124000 | 98000 |
| Customers | 840 | 720 |
| NPS | 62 | 54 |
| Churn % | 2 | 3 |
Step by step
How to make a KPI scorecard
Drop your numbers in, or import a CSV.
Choose the chart, theme and animation speed.
Tune colours, labels and add your brand.
Download MP4, GIF, PNG or SVG.
Best practices
Get it right
- ✓Keep to four to six metrics so each stands out.
- ✓Include a previous value so the trend shows.
- ✓Use clear units in the label ($, %, count).
- ✓Pick the metrics that define the period, not all of them.
- ✕Crowd a dozen tiles onto one card.
- ✕Omit the previous value, the trend is the point.
- ✕Mix wildly different units without labelling them.
- ✕Use it when one number deserves the whole frame.
Watch out
Common mistakes to avoid
Past about six metrics the scorecard becomes a wall of numbers and nothing lands. Curate to the few that matter.
A value with no previous period is just a stat. The trend arrow is what makes a scorecard tell a story.
Is 2 a percentage, thousands or a count? Put the unit in the label so every tile is unambiguous.
If a single figure is the story, a number counter gives it far more impact than a scorecard tile.
Why Reochart
Built for sharing, not just charting
- ✓No design skills required
- ✓Animated MP4 and GIF exports
- ✓PNG and scalable SVG too
- ✓Your brand colours and logo (Pro)
- ✓Paste from a sheet or import a CSV
- ✓Presentation and feed ready in minutes
FAQ
Frequently asked questions
What is a KPI scorecard?
A KPI scorecard is a panel that presents several headline metrics together, each showing its current value alongside the change versus the previous period, usually with an arrow or a colour indicating direction. Where a number counter dedicates an entire frame to one figure, a scorecard accepts less emphasis per metric in exchange for showing the four or five numbers that together describe how a business is actually doing. That trade is the right one for a recurring update, because the audience for an investor email, a board pack or a weekly review needs the whole picture rather than one highlight. The deltas are what make it a scorecard rather than a list of numbers: a value on its own is not interpretable, while a value plus its movement since last month tells the reader whether things are improving without any commentary attached.
Can it show trends?
Yes. Add a previous value for each metric and Reochart shows an up or down trend arrow alongside the figure.
Scorecard or number counter?
Use a scorecard to show several metrics together. Use a number counter when one figure deserves a whole frame.
Scorecard or bullet chart?
A scorecard compares each metric to its previous period. A bullet chart compares each metric to a specific target, drawing the goal as a tick so hitting or missing it is instantly visible.
How many metrics should it have?
Four to six reads best. A scorecard is a summary, so curate to the numbers that define the period.
Can I make it animated?
Yes. Charts animate by default, and you can export the animation as an MP4 or GIF, or grab a static PNG or SVG if you prefer.
Can I export as SVG?
Yes. Pro exports a crisp, scalable SVG vector, alongside MP4, GIF and PNG. Every export renders at 1080p.
Is Reochart free?
Yes. The free plan lets you make every chart type except the animated bar chart race, and export an animated MP4 with a small watermark, no card needed. Pro adds the bar chart race, removes the watermark, and adds GIF and SVG, your brand colours and logo, longer videos and CSV import.
Keep exploring
Related generators
From the blog
Learn more about charts and data storytelling

11 min read
How to Create an Animated Number Counter
A step-by-step guide to building a number counter that actually lands: picking the number worth this treatment, setting an honest start point, adding the context that makes it mean something, and exporting an animated version for a launch post, a deck, or a milestone update.
Read article →

11 min read
How to Build a QBR Dashboard
A practical guide to building the handful of charts a quarterly business review actually needs: the growth number, the bridge that explains it, the pipeline read, the KPI scorecard, and the roadmap for what's next.
Read article →