Feed post
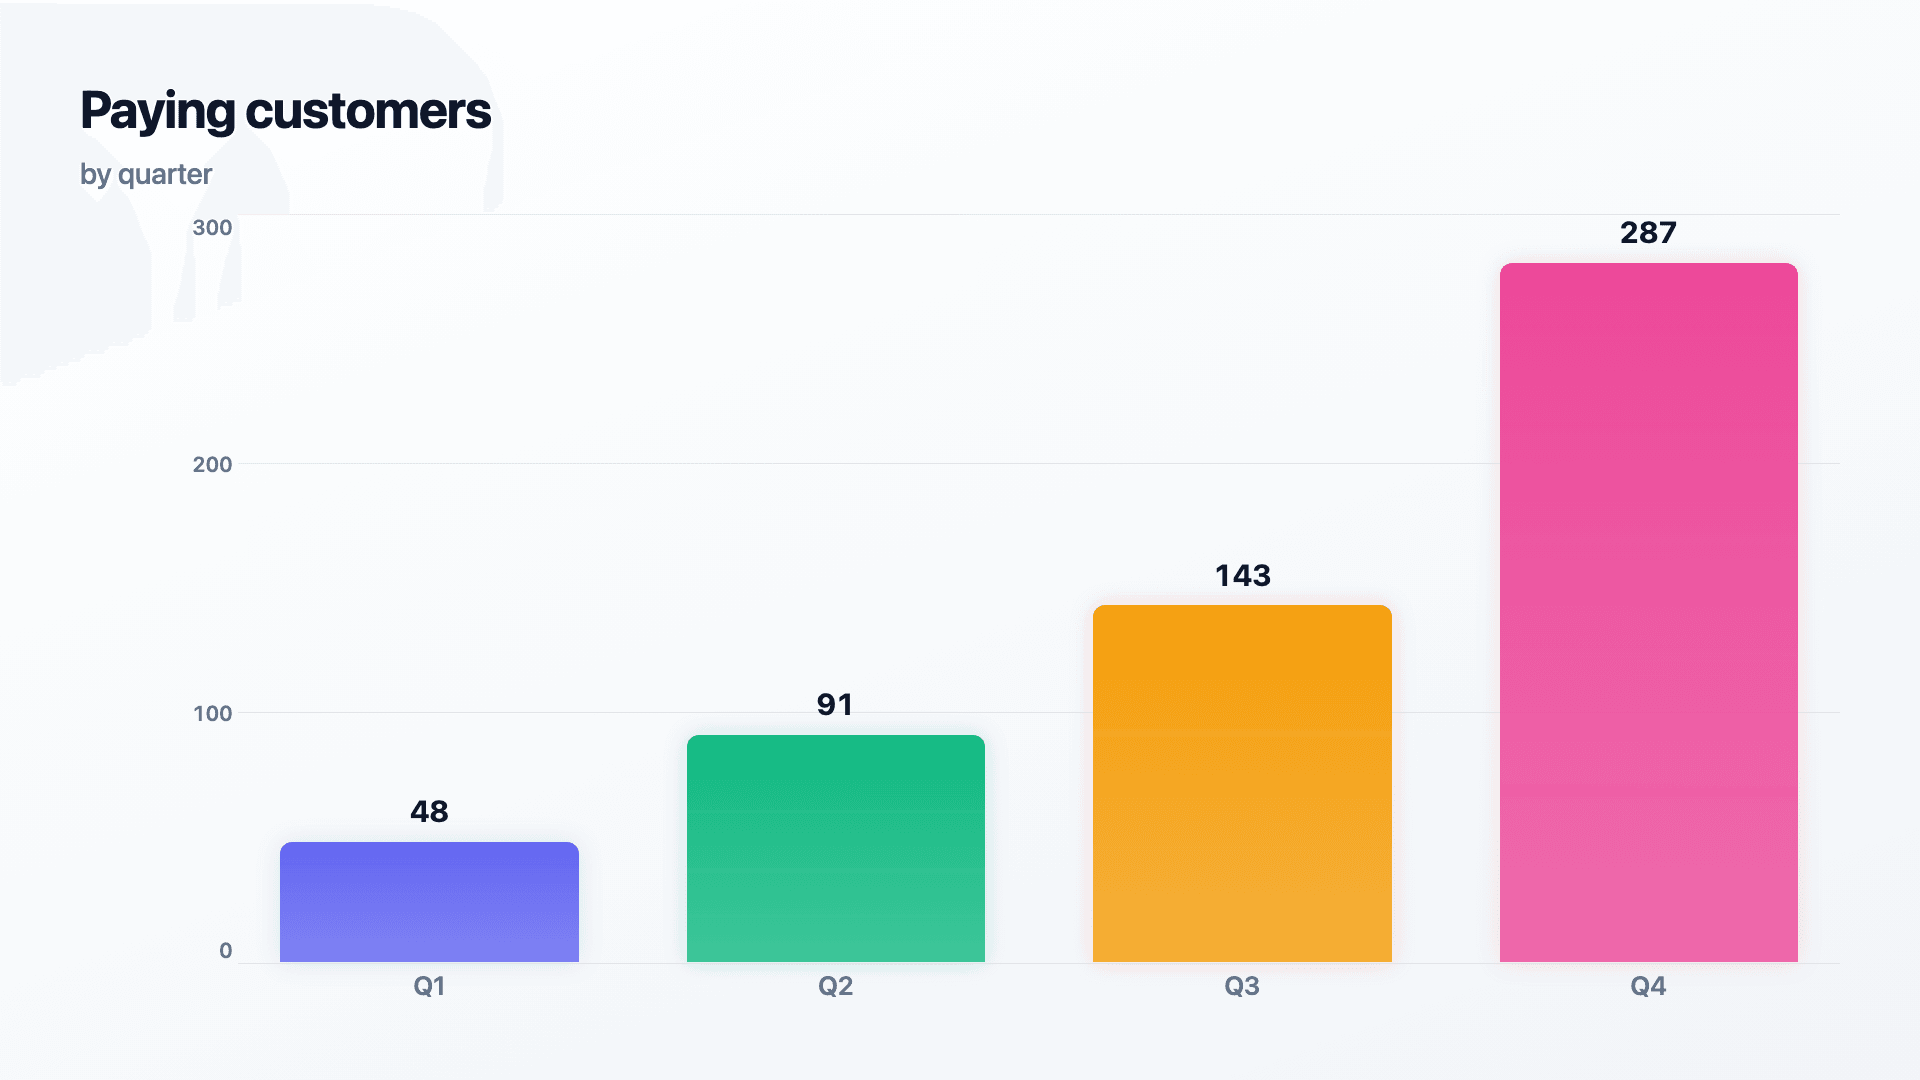
Autoplays in the feed while the caption does the talking.
Your data deserves
better than a screenshot.
Paste your numbers, pick a visual, and export an animated chart, funnel or timeline. Ready to post in under two minutes.
No credit card · Free forever plan
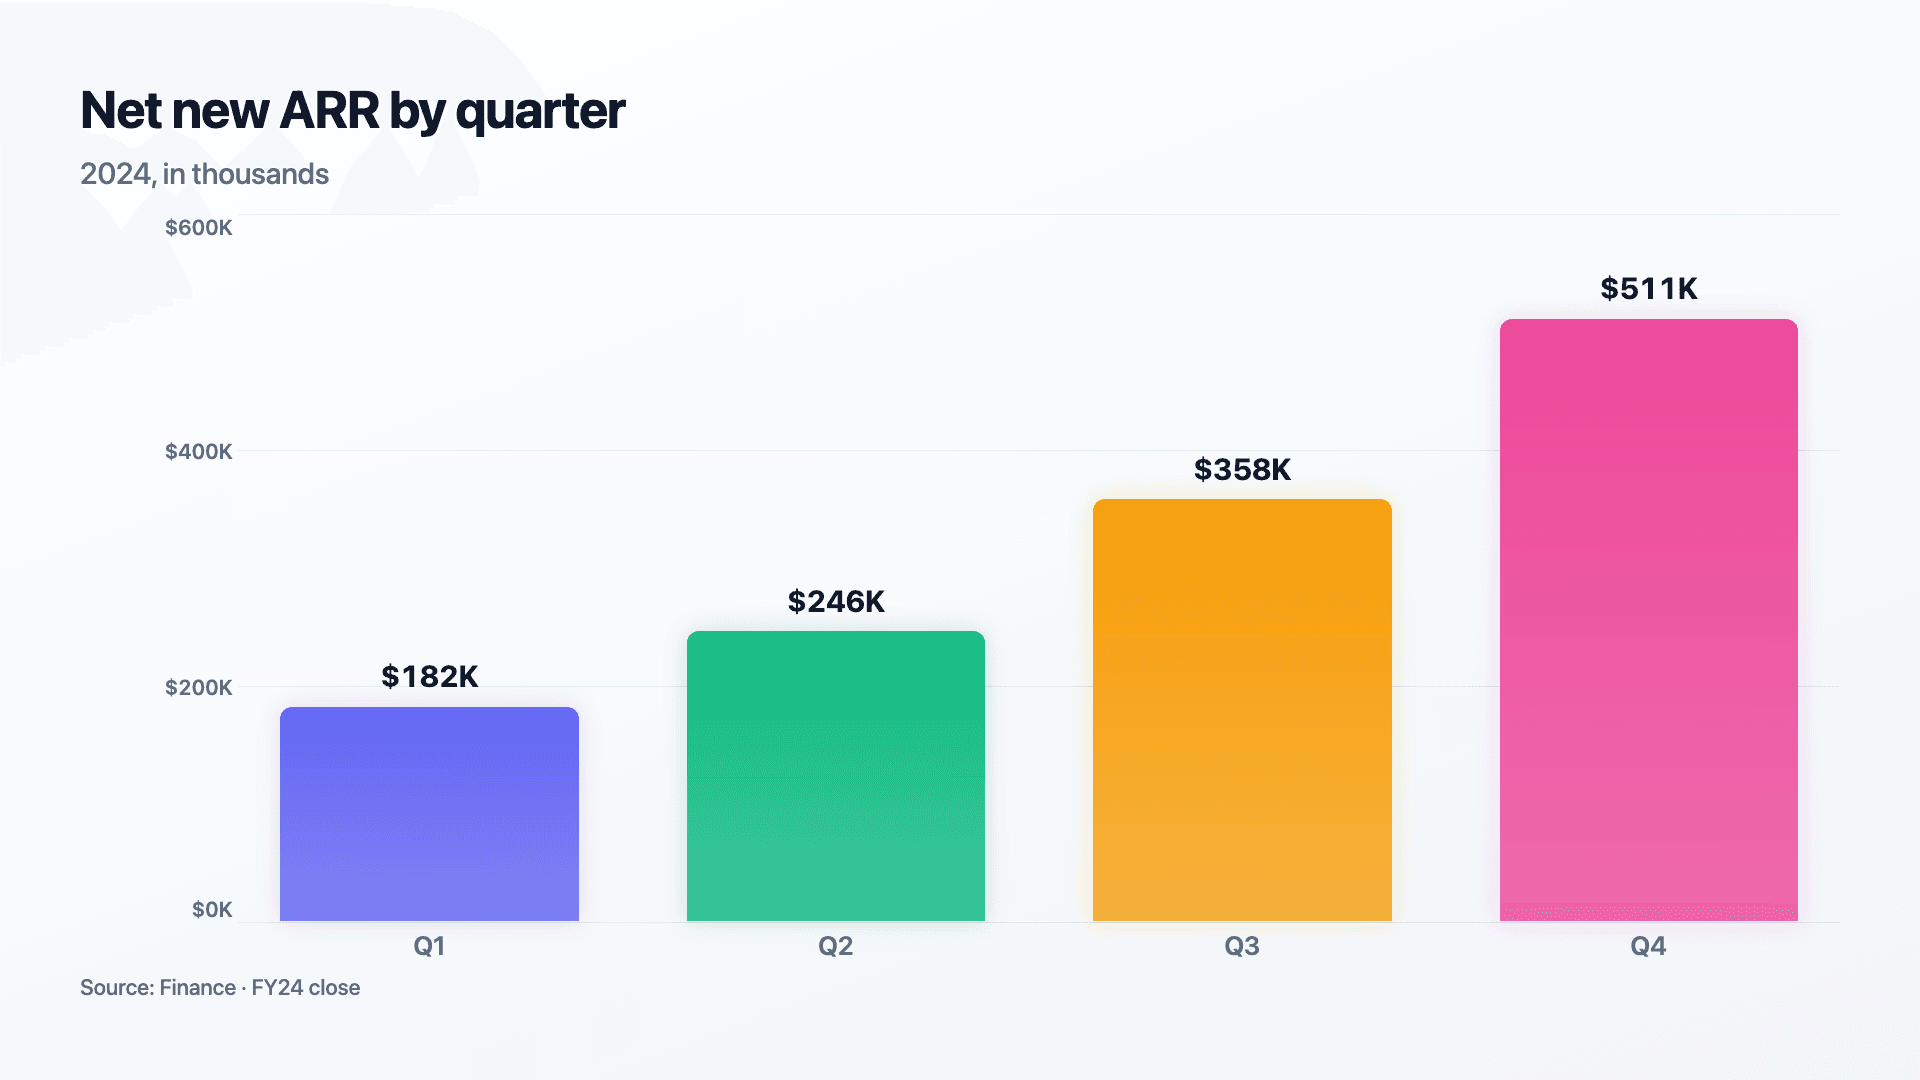
How it works
Type or paste your rows, then add a title and source. No formulas.
Choose from 30 charts and story visuals, set a theme, watch it animate as you type.
Download a crisp image or smooth video — PNG, MP4, GIF or SVG — in seconds.
Charts
Growth curves and comparisons, made obvious.
How the parts add up, side by side.
One number, when that's the whole story.
Narrative visuals that explain the why.
Export anywhere
Export once. Drop it into a post, a deck, or a newsletter. It still moves.
Feed post
Autoplays in the feed while the caption does the talking.
Carousel post
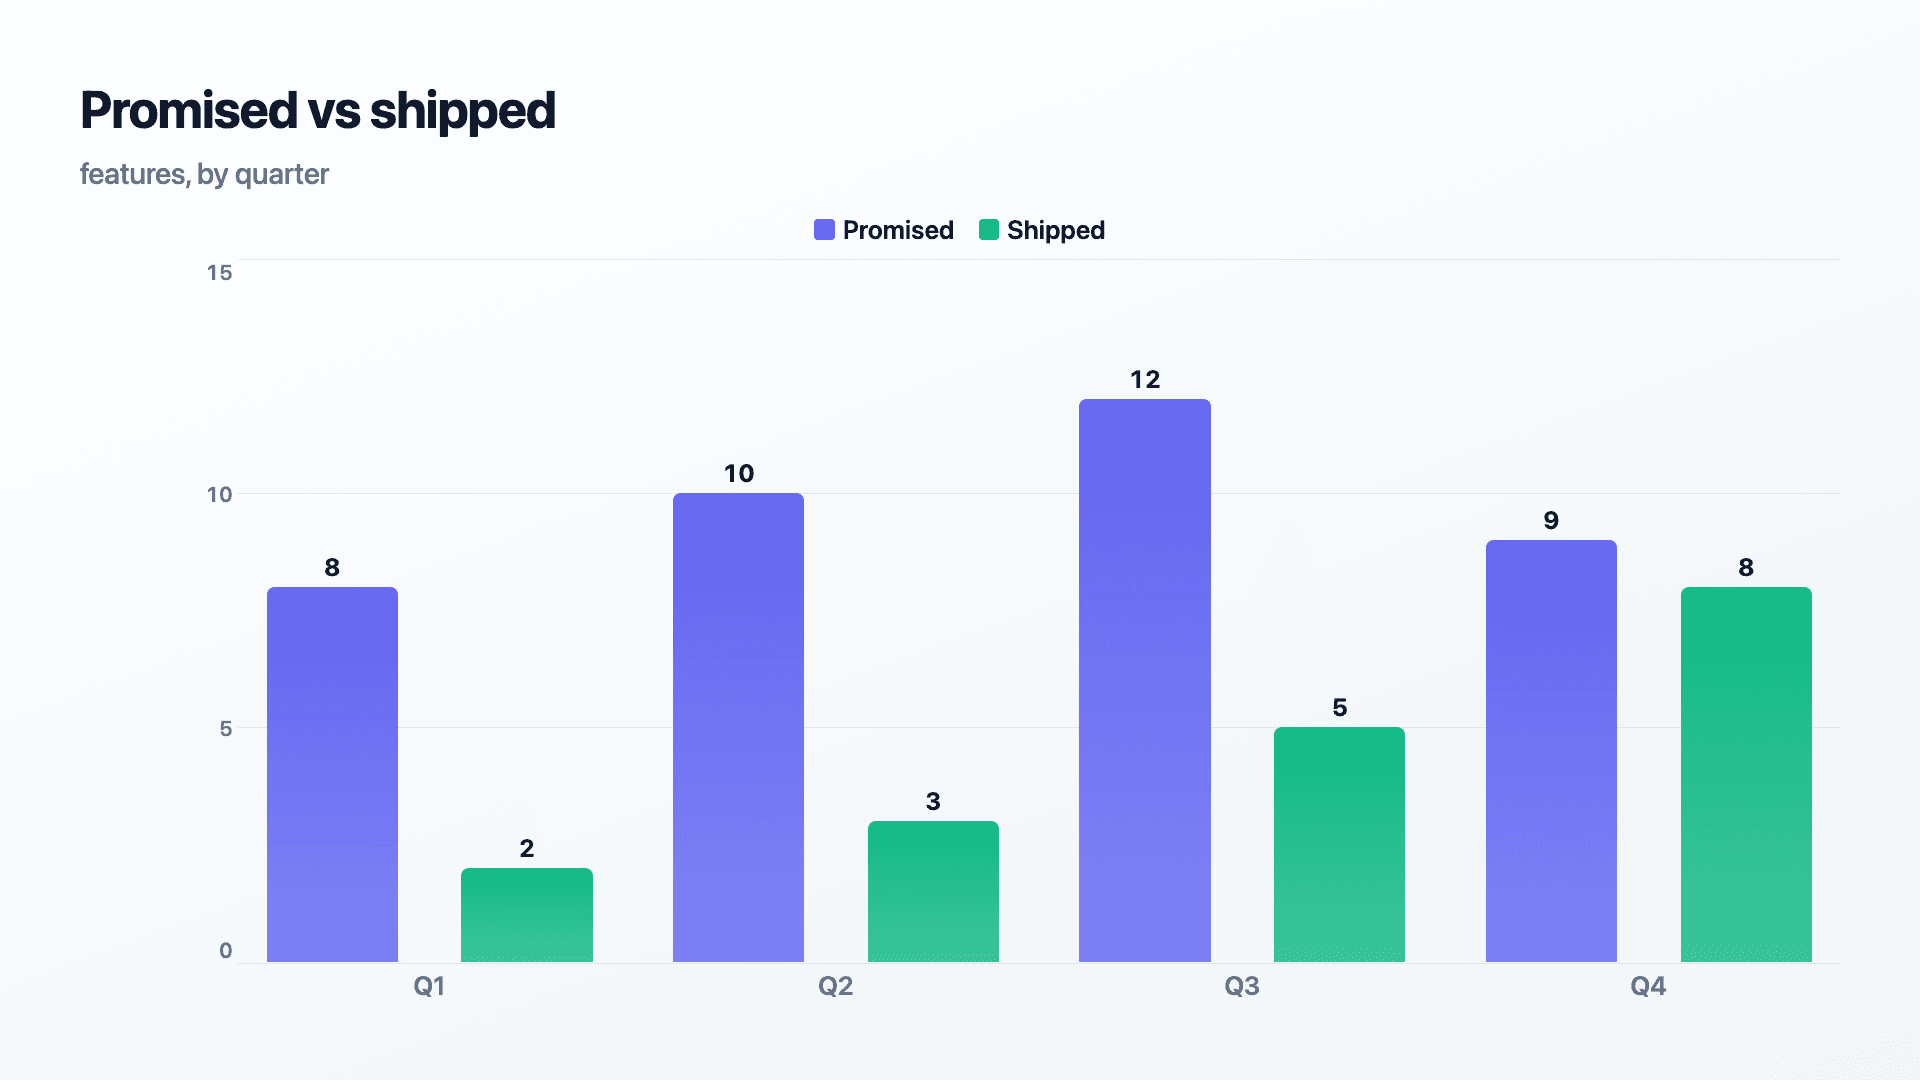
A scroll-stopper, not another flat screenshot.
Newsletter
Email issue

Drops straight into an email and still moves.
Slide deck
Investor deck
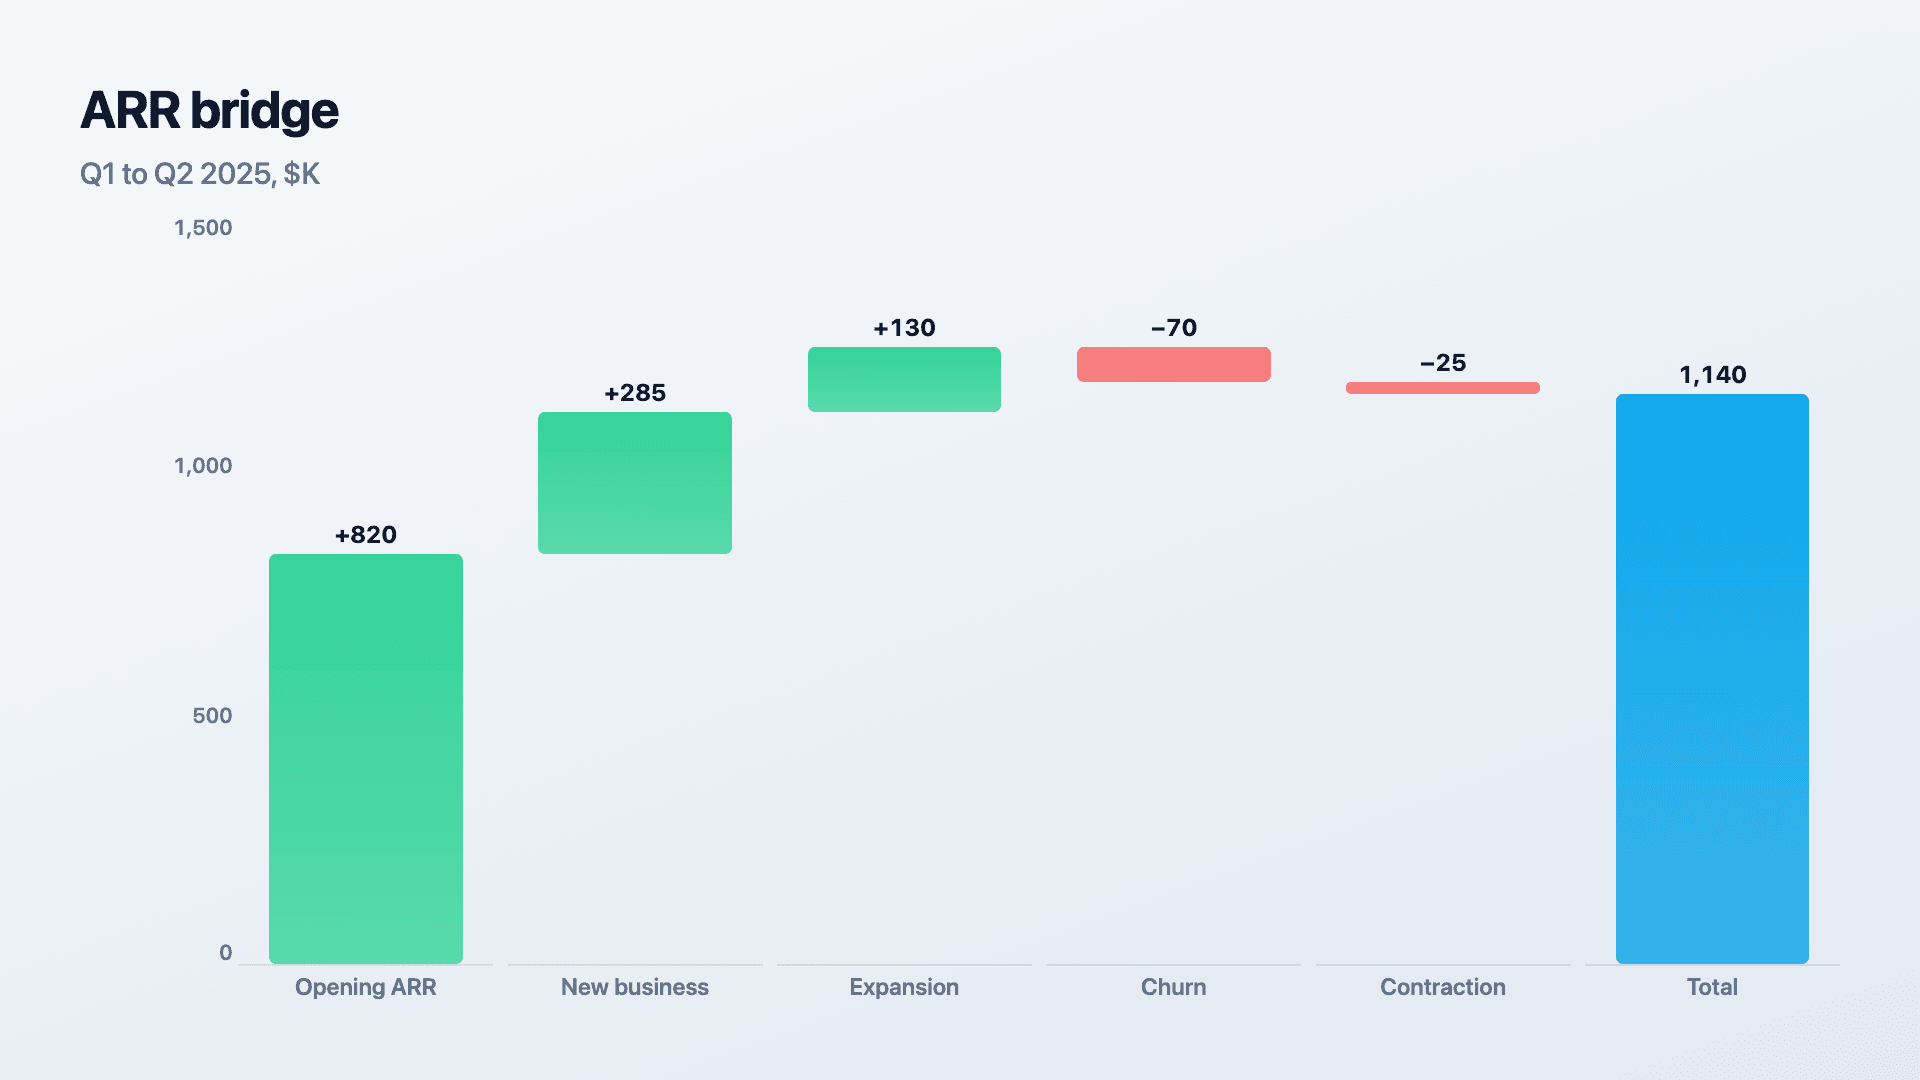
Plays live, mid-presentation, no exporting to video.
Who it’s for
Turn traction into belief.
Post the MRR jump, the user milestone, the growth curve — proof that momentum is real, in a format people stop for.
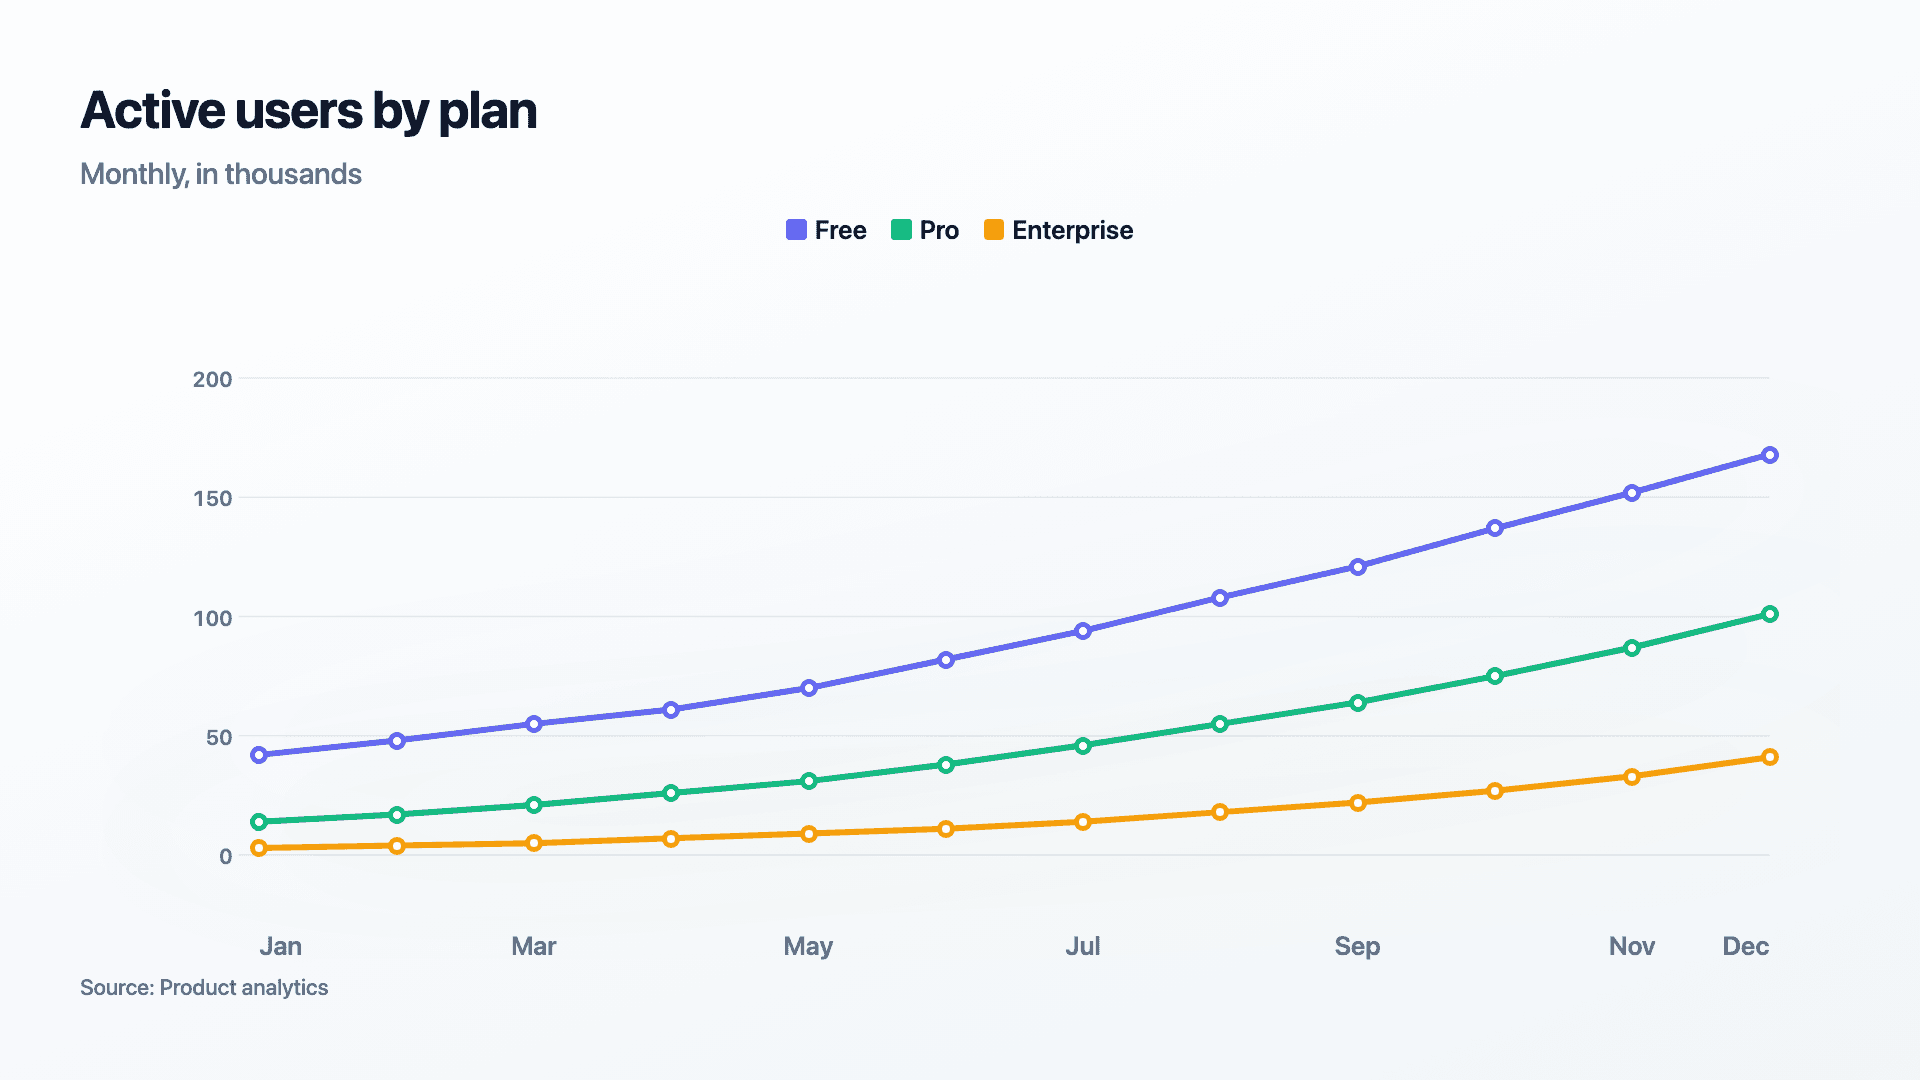
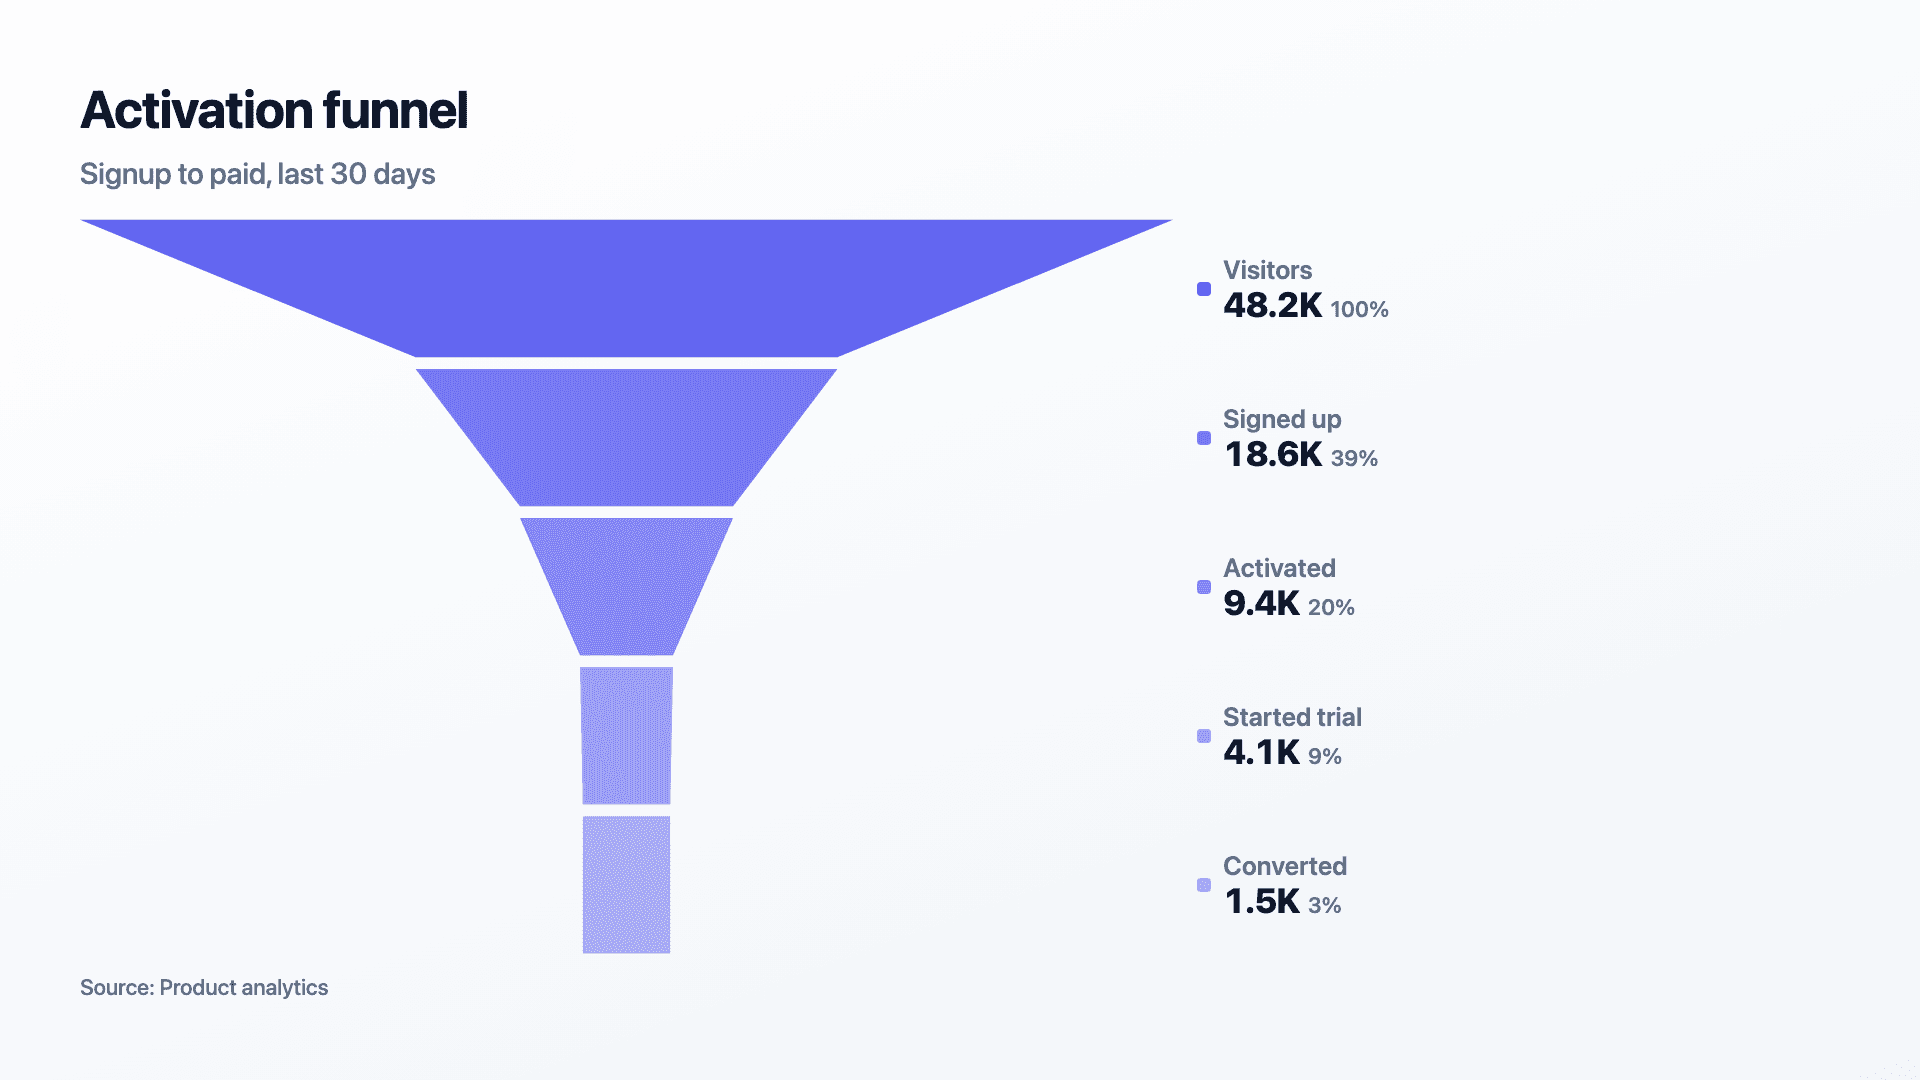
Make the results the content.
Campaign wins, funnel lifts and weekly KPIs become scroll-stopping posts instead of screenshots buried in a slide.
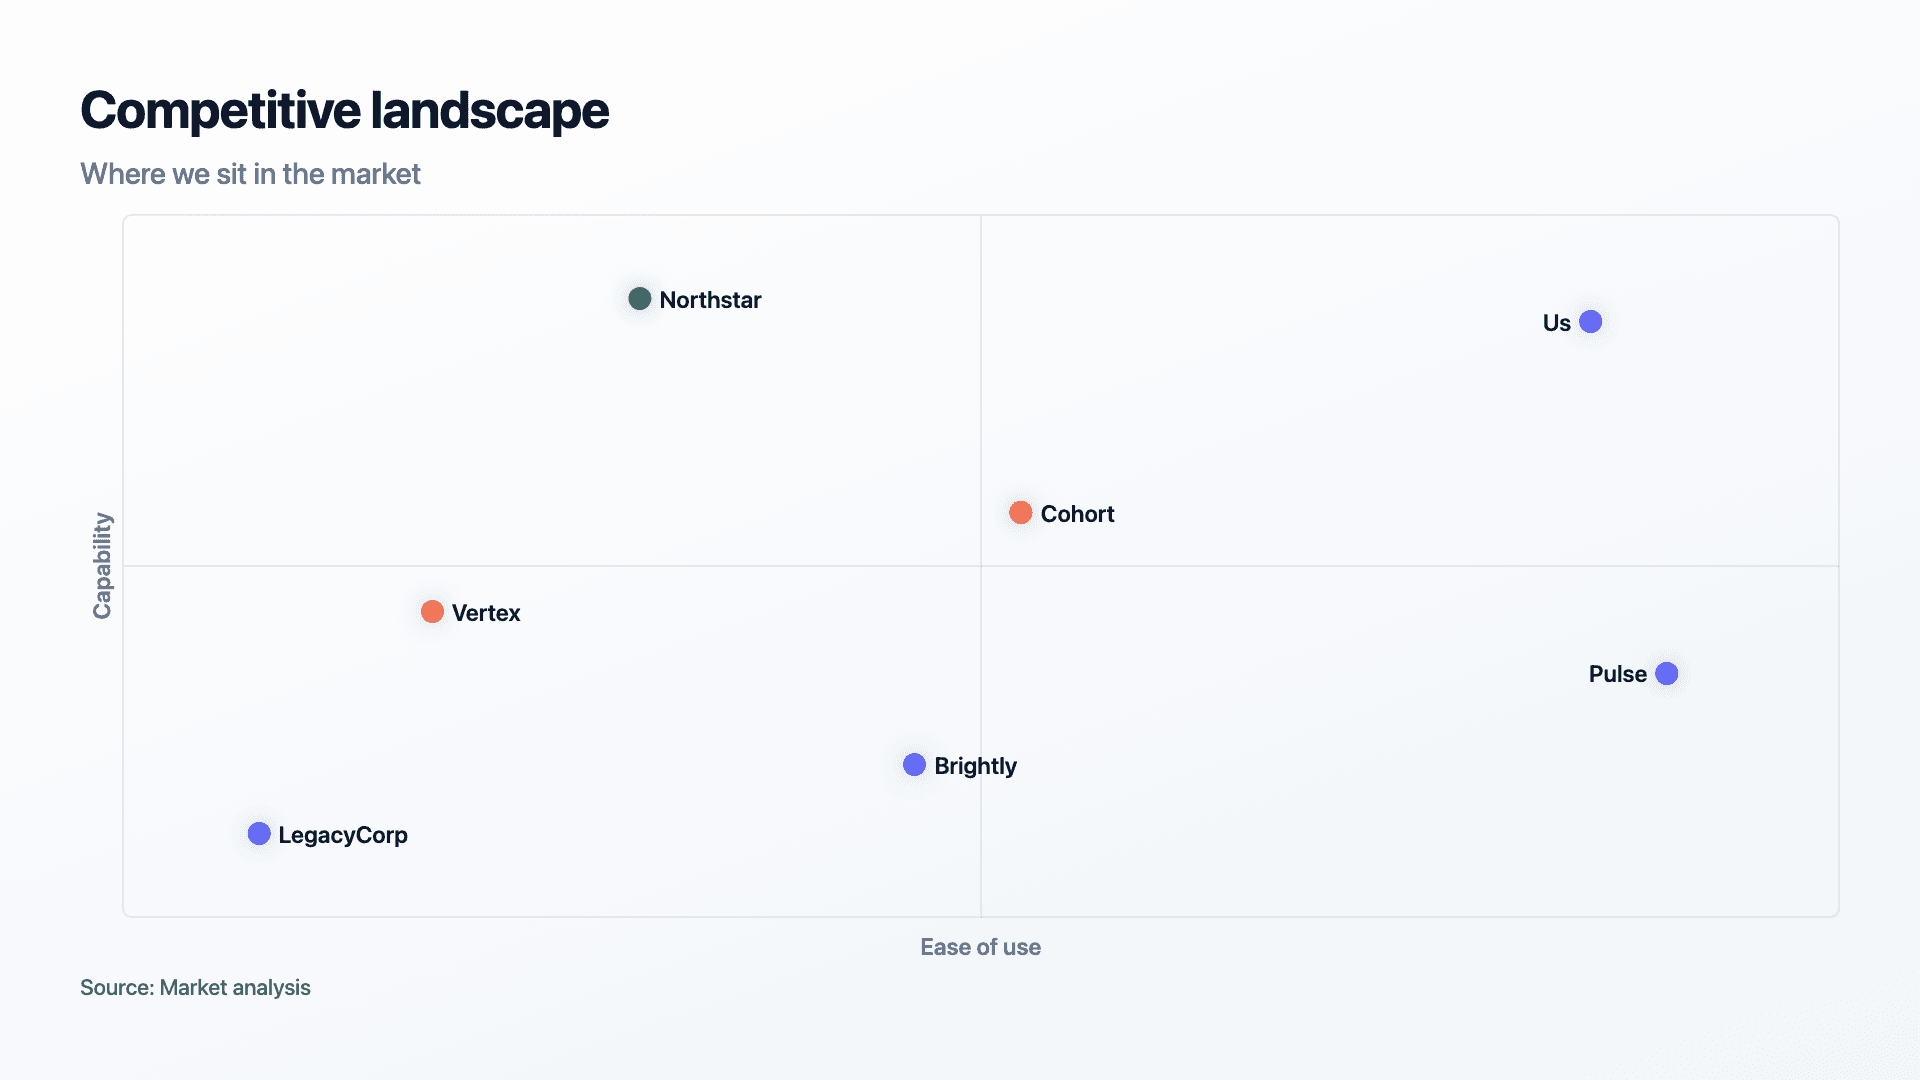
Look as sharp as your analysis.
Frameworks, benchmarks and findings rendered with a polish that signals authority to clients, on your own brand.
Why Reochart
You could use PowerPoint. And it will look like it.
Spreadsheet & PowerPoint
Reochart
Icons
1,700+ animated icons for a post header, a slide intro or a website hero. Free on every plan.
Rocket
Heart
Trending up
Sparkles
Star
Definition
It turns raw numbers into a chart, graph or data story that moves: bars grow, lines draw themselves, funnels narrow. Not a flat screenshot from a spreadsheet.
Reochart is built specifically for that: paste your data, choose from 22 chart and story visuals, and export the result as an MP4, GIF, PNG or SVG. No animation software, no design background, and no per-chart template hunting — most charts are ready to post in under two minutes.
It's the difference between a chart that gets scrolled past and one that gets a screenshot of its own.
Default spreadsheet chart — static
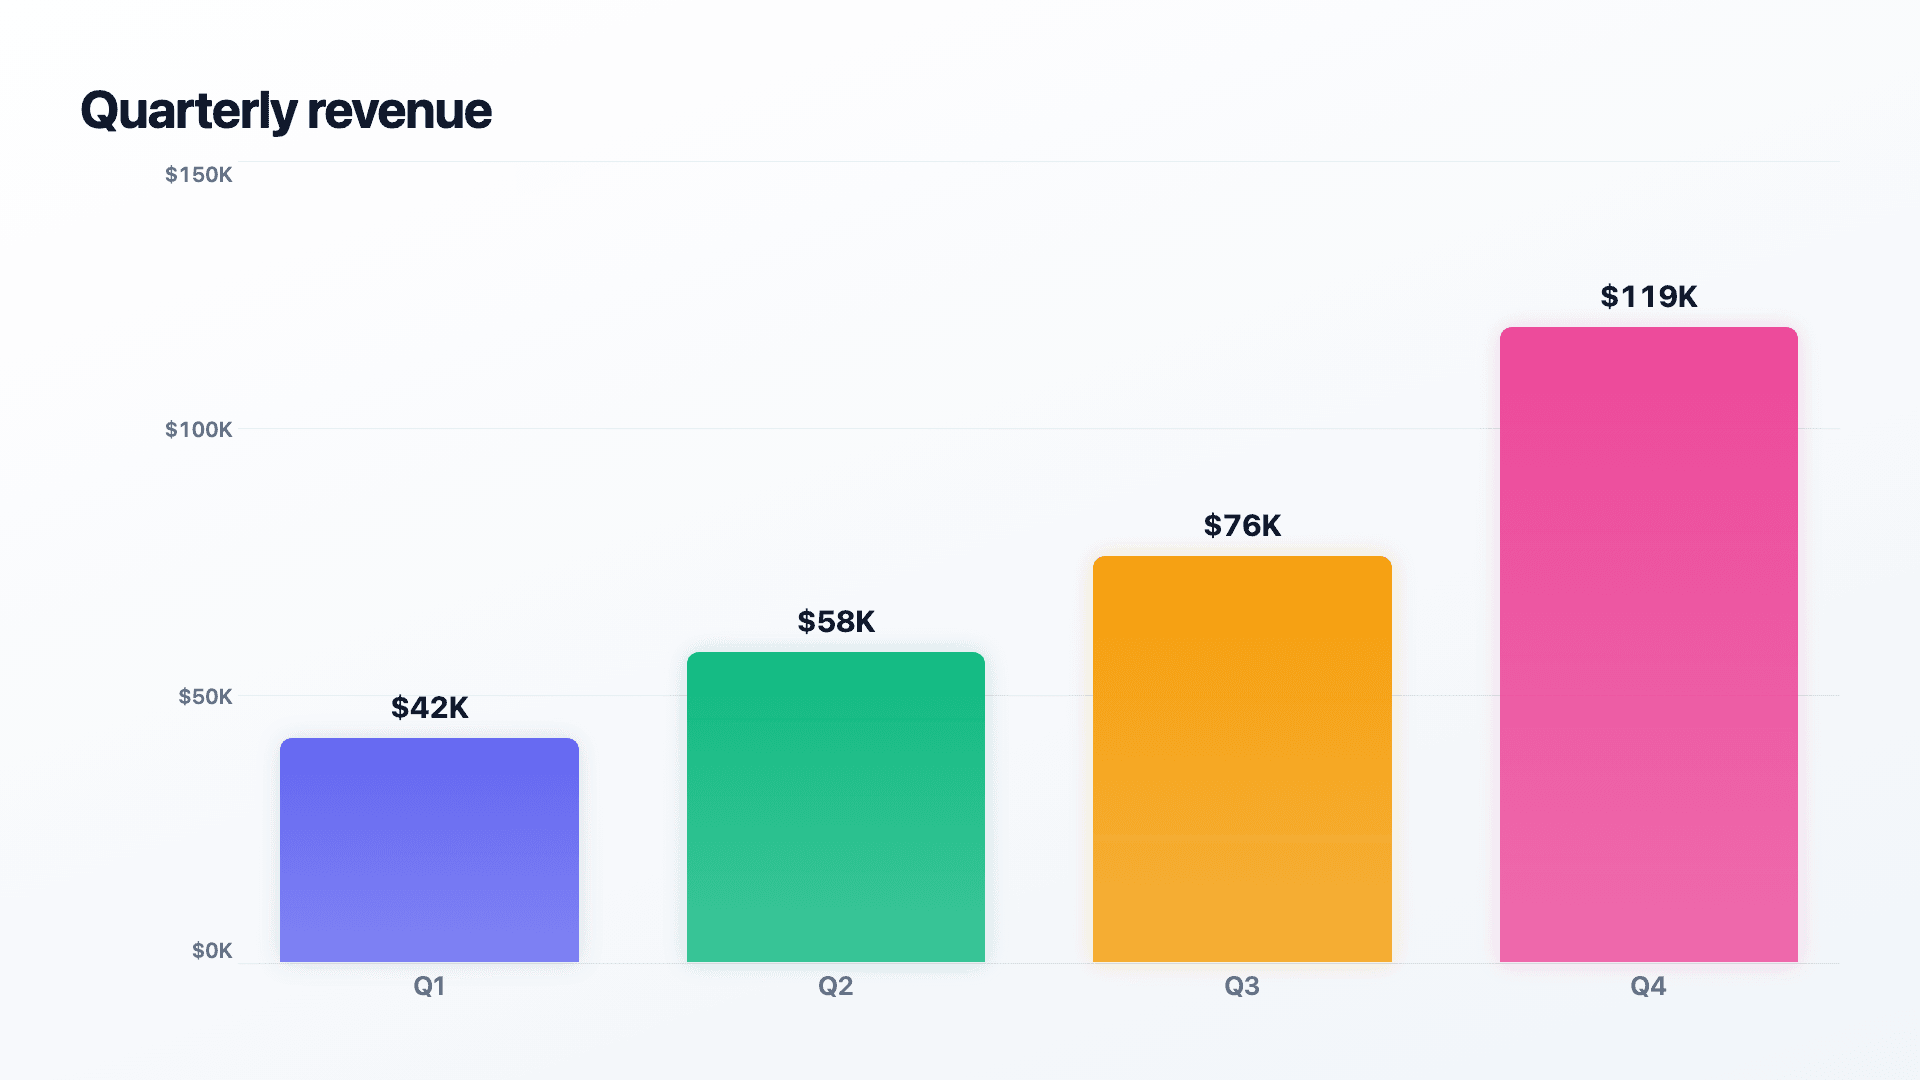
Same data, made in Reochart — animated
Blog

July 21, 2026 · 11 min read
A step-by-step guide to building a number counter that actually lands: picking the number worth this treatment, setting an honest start point, adding the context that makes it mean something, and exporting an animated version for a launch post, a deck, or a milestone update.

July 19, 2026 · 11 min read
A practical guide to building the handful of charts a quarterly business review actually needs: the growth number, the bridge that explains it, the pipeline read, the KPI scorecard, and the roadmap for what's next.

July 18, 2026 · 11 min read
A step-by-step guide to building a product roadmap that actually gets read: how to choose a time horizon, group work into themes, decide between a timeline and a swimlane layout, and export an animated version for a planning meeting, an investor update, or a post.
FAQ
A tool that turns spreadsheet data into a chart, graph or data story that moves — bars growing, lines drawing, funnels narrowing — instead of a static image. Reochart lets you paste data and export the result as an MP4, GIF, PNG or SVG.
Yes. The free plan lets you make every chart type and export an animated MP4 with a small watermark, no card required. Pro removes the watermark and adds GIF and SVG export, brand colours and logo, longer videos and CSV import.
No. Paste your data, pick a chart type and theme, and the motion, layout and spacing are handled for you.
PNG, MP4, GIF and SVG (SVG and GIF on Pro). Every export renders at 1080p.
Yes, on Pro — set a brand palette and add a logo that replaces the watermark on every export.
Canva and PowerPoint charts are static and built from generic templates. Reochart is purpose-built for data specifically, with 30 chart and story visuals — including funnels, waterfalls and timelines that don't exist in either tool — and every one animates on export.
Just rows of labels and numbers — paste them straight from Excel or Google Sheets, or import a CSV (Pro). No formulas or setup required.
Anywhere that accepts an image or video: LinkedIn and X posts, Instagram, email newsletters, and slide decks (it plays live, mid-presentation, with no separate video export step).
Free forever to start. Pro is $8/mo when you want your brand on it.