Annual Report Chart Maker
Make year-in-review charts that look considered and read clearly. Export as PNG, SVG, GIF or MP4.
Free to try · No design skills · Ready in about two minutes
Trusted by 1,203 users, including people at
 ByteDance
 Arizona State
 Fox
Fox UT Austin
 Roche
Roche Tulane
 United Airlines
 Clemson
 NHS
NHS Ayming
 Marquette
 Kent State
 Ray White
 UC Riverside
 CBA
CBA Illinois Tech
 Venngage
 Hofstra
 House of Communication
 IIT Madras
 Sotherly Hotels
 Zenus.ai
Overview
What this tool is for
An annual report, an impact report, a year-in-review post — they all live or die on how clearly the numbers read. This is the one document where a year of work gets summarised, and default spreadsheet charts make that year look like an afterthought. The reader wants to understand growth, composition and what moved the headline number, quickly.
The core annual-report charts are year-over-year comparisons (this year against last), a bridge that explains what drove the change, a composition view for how the total breaks down, and a headline counter for the number everyone remembers. Each has a chart that fits, and consistency across them makes the whole report feel authored rather than assembled.
Reochart turns your year-end numbers into polished, on-brand charts for a PDF, a slide, or a web recap. Build the growth bars, the revenue bridge and the breakdown once, export crisp PNG or SVG for print-quality documents, and the report signals the same care as everything else you shipped this year.
How it works
How to make annual report charts
Map each section to a chart: grouped or comparison bars for this year vs last, a waterfall to bridge from last year's number to this year's, a donut or stacked bar for composition, and a counter for the headline figure. Enter the data, name the series, and set your brand palette.
Keep a consistent look across every chart in the report so it reads as one document. Export SVG or high-resolution PNG for print and PDFs, where crispness matters more than motion.
Examples
Example charts
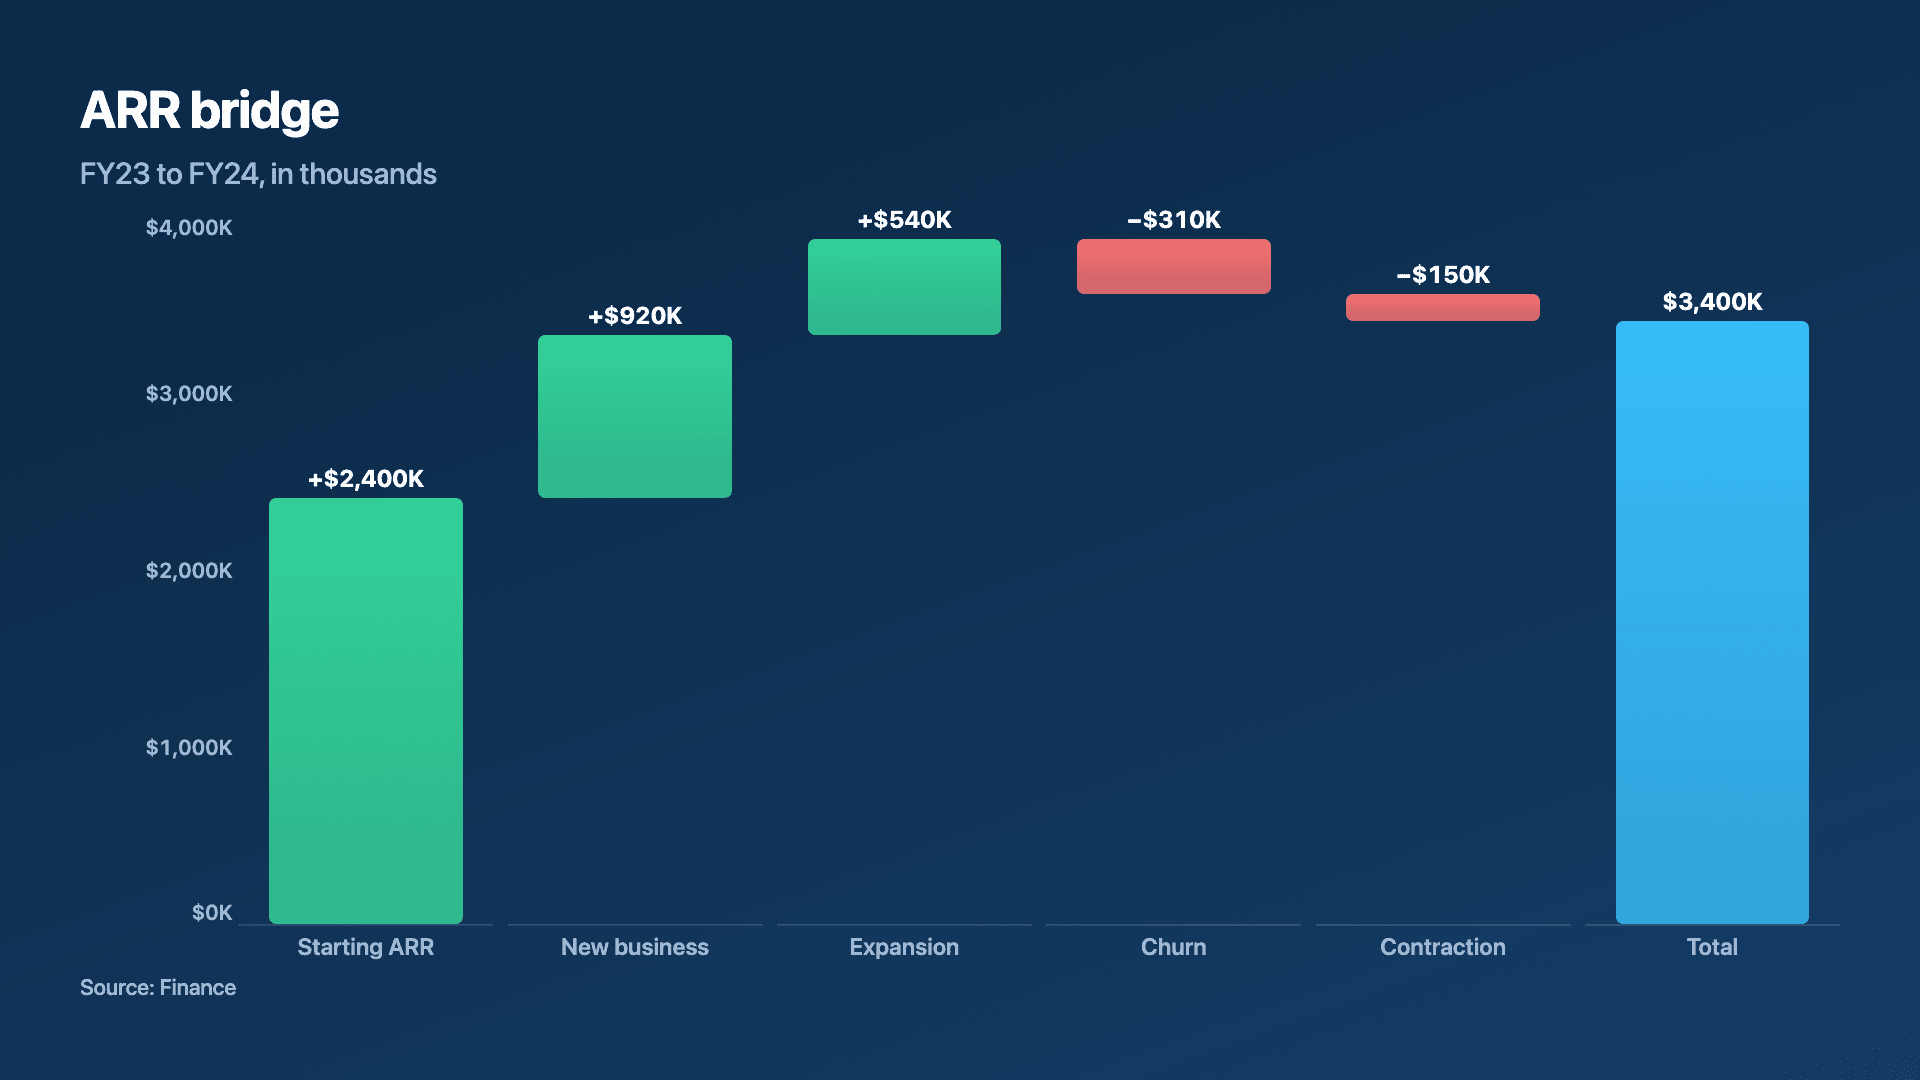
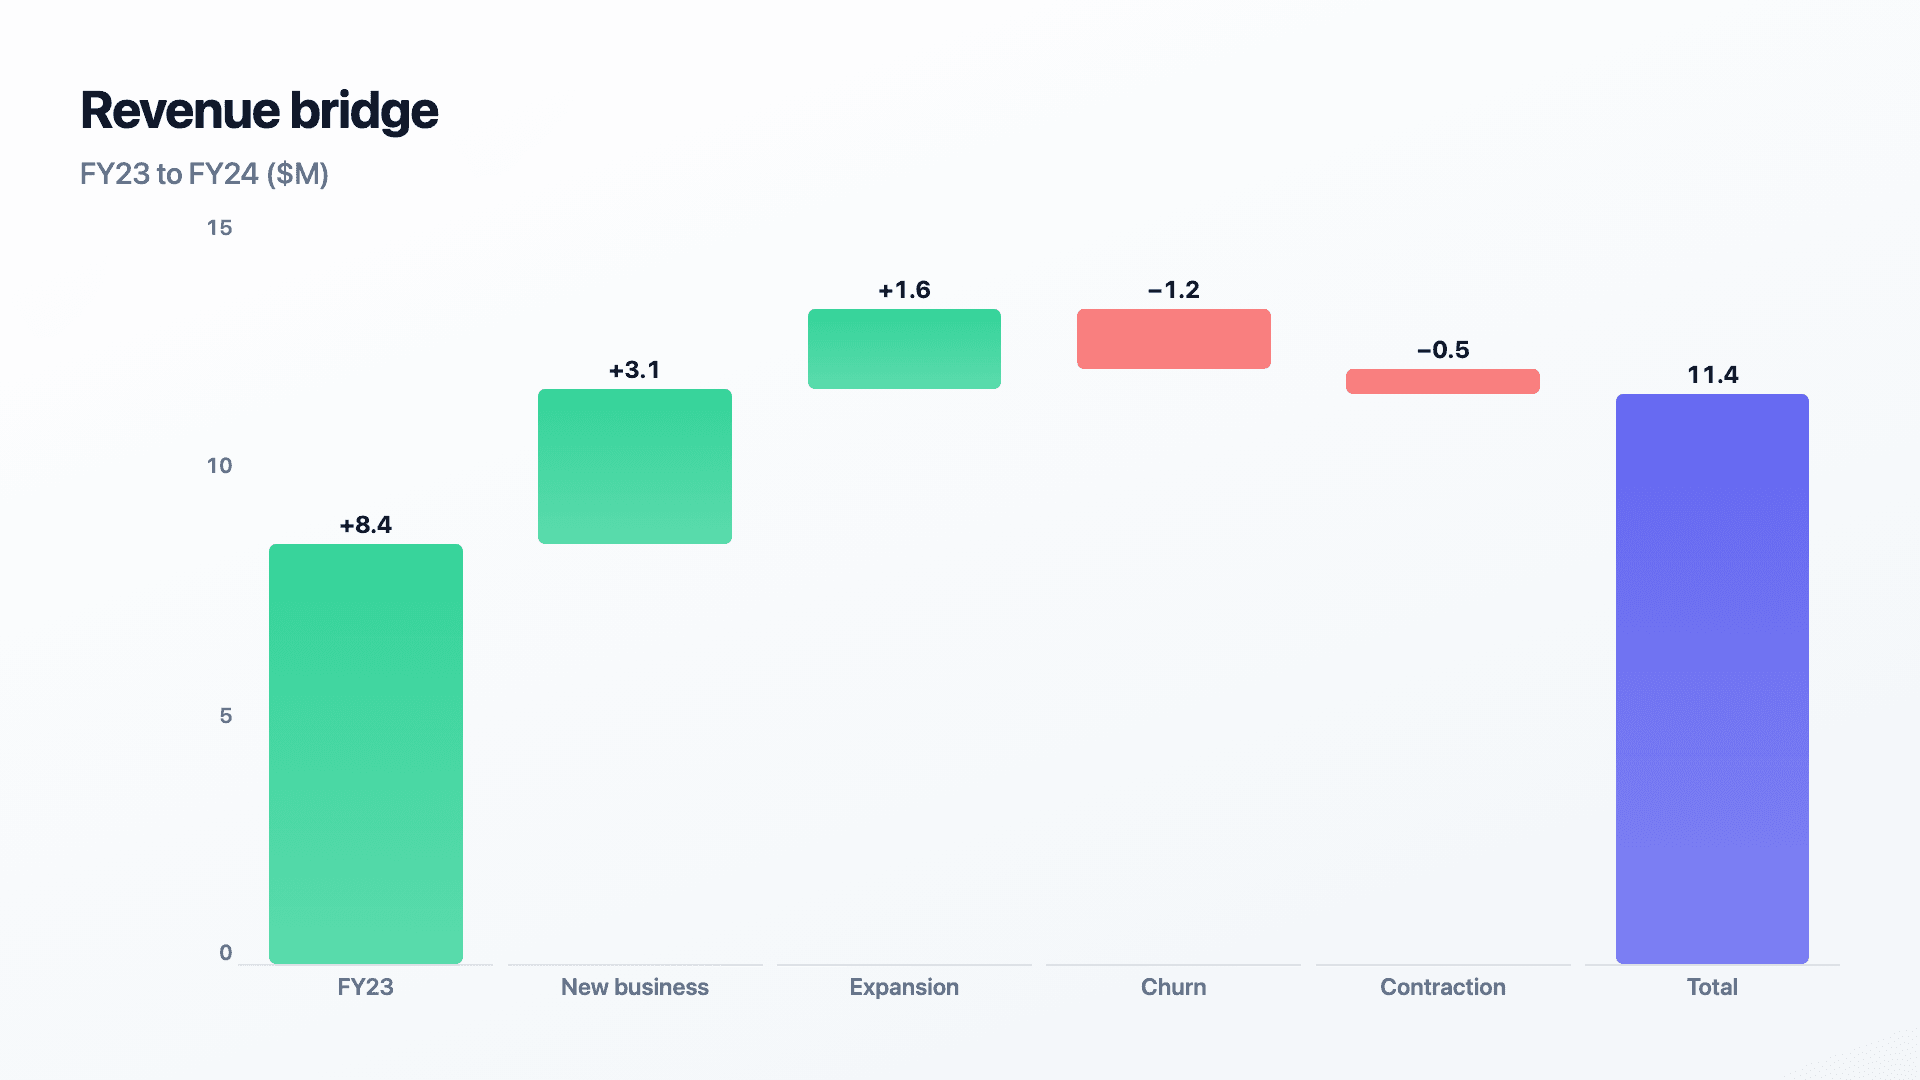
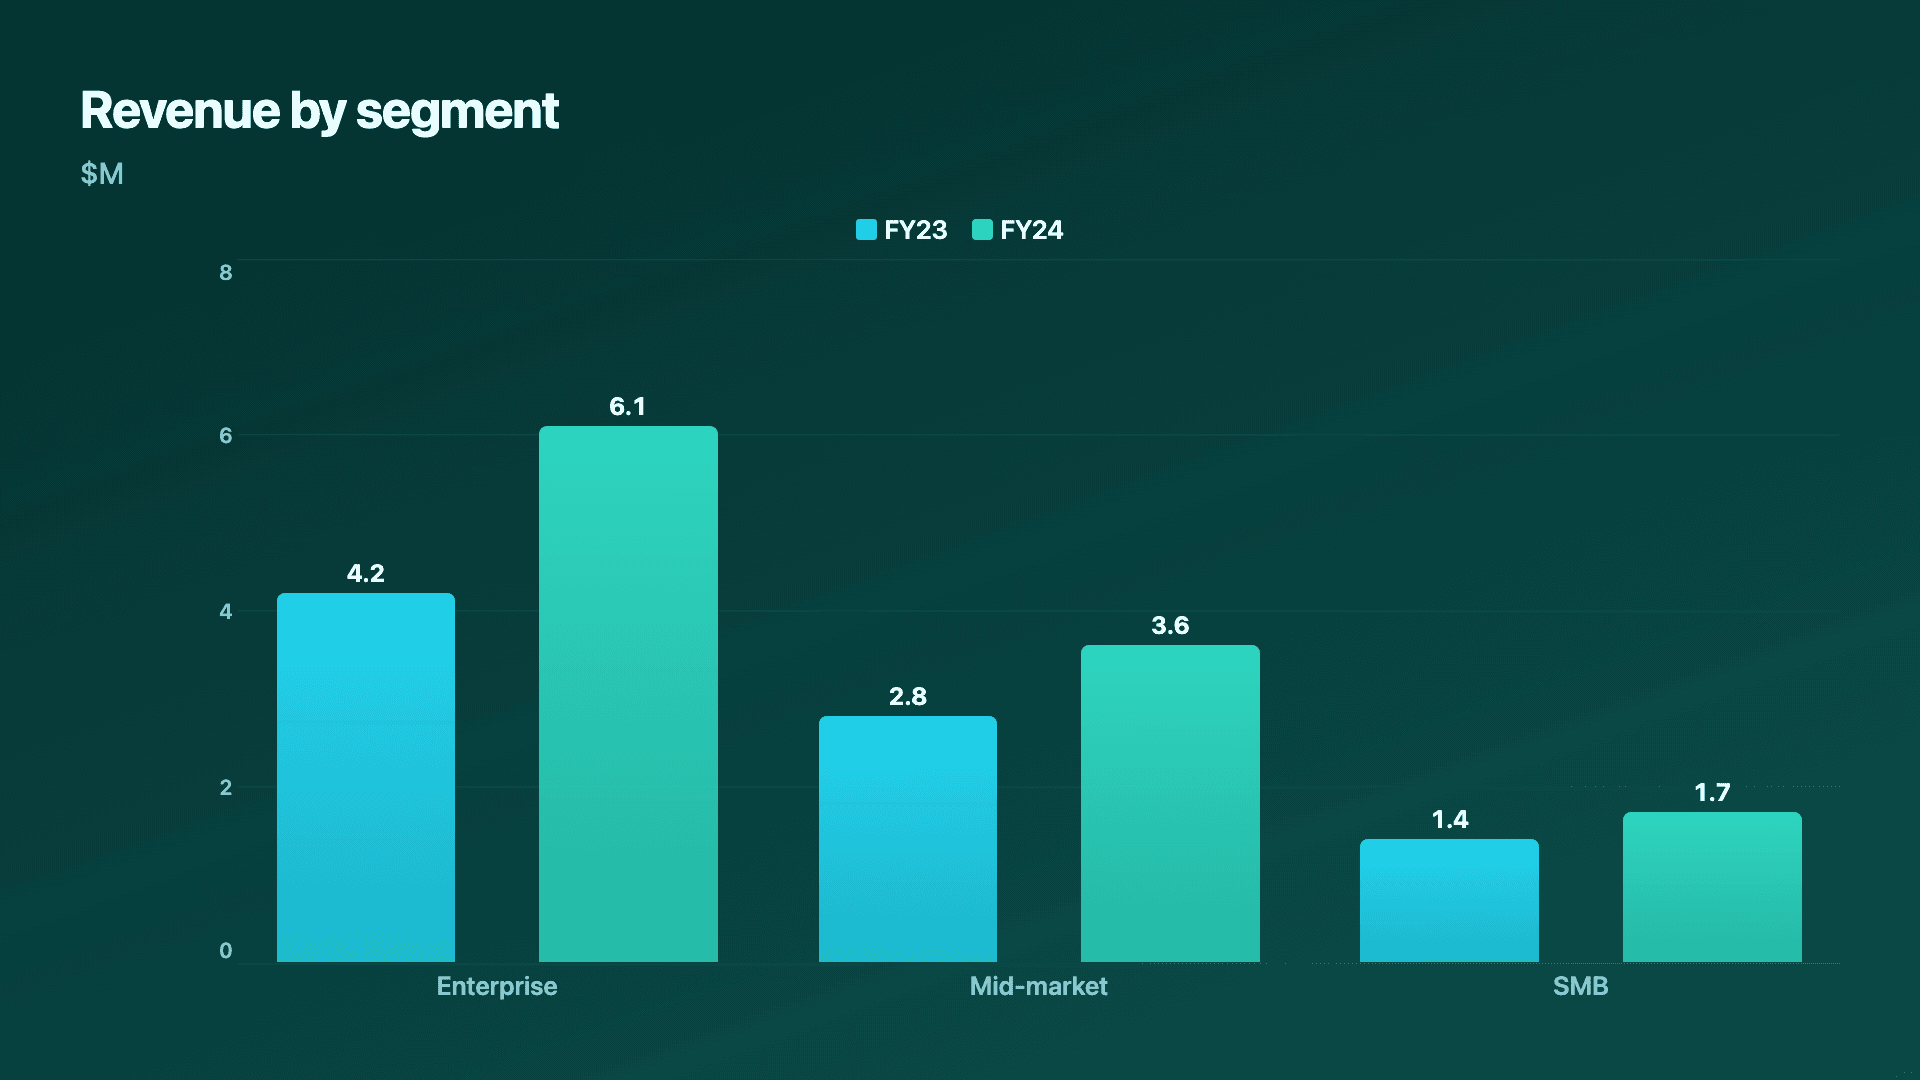
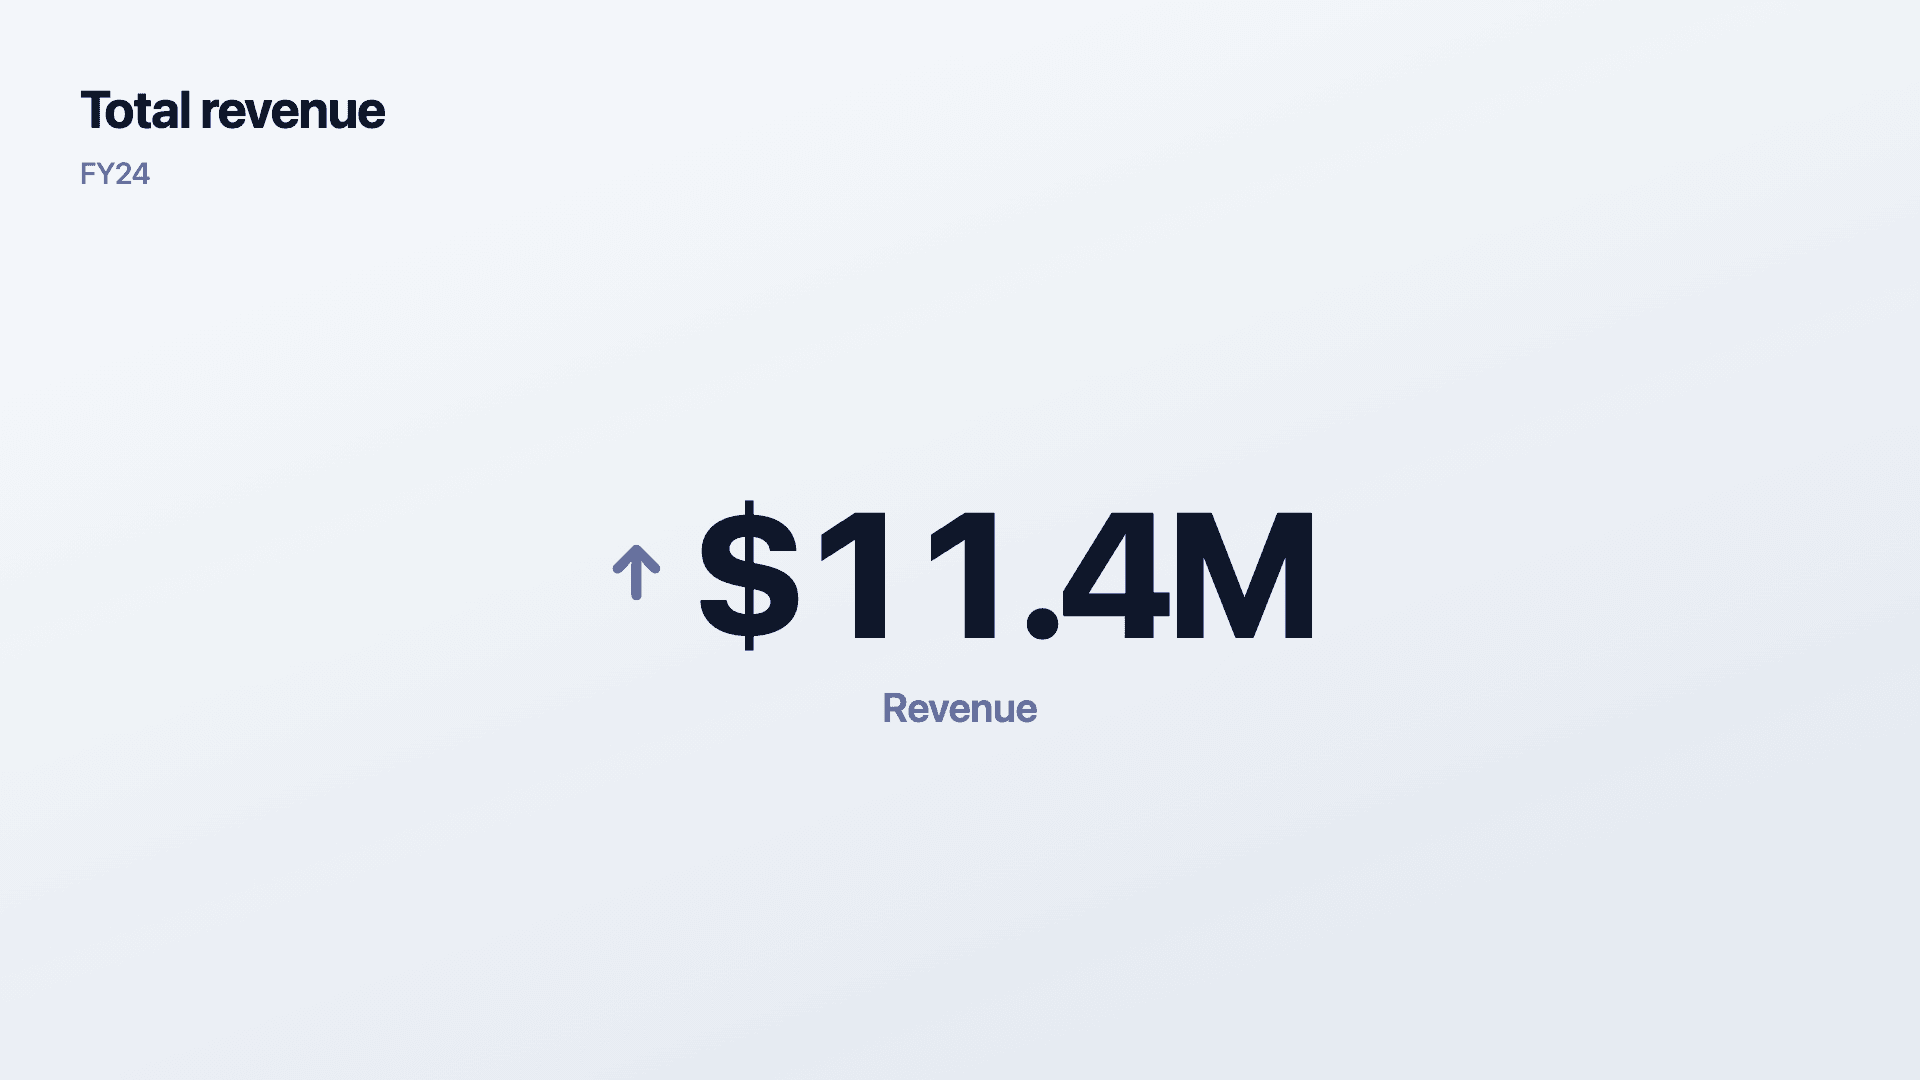
Real charts made in Reochart, each with its own data and theme. They animate automatically as you scroll.
Good fit
When to use it
- ✓Year-over-year comparisons
- ✓Revenue or headcount bridges
- ✓Composition and segment breakdowns
- ✓Impact and sustainability reports
- ✓Year-in-review posts and PDFs
Reach for something else
When not to use it
- ✕You need audited, exact figures, pair charts with a data table.
- ✕The report is quarterly or monthly, use the QBR format instead.
- ✕One metric is the whole story, a counter is enough.
- ✕The data is provisional, wait until the year is closed and signed off.
Compare
Which chart to use
Which chart for which report section.
| Section | Best chart | Why |
|---|---|---|
| This year vs last | Comparison bars | Side-by-side per segment |
| What drove the change | Waterfall | Bridges start to end |
| How it breaks down | Donut or stacked | Composition of the total |
| The headline figure | Counter | The number people remember |
Your data
What data you need
A waterfall uses a start value then signed changes (negatives step down). Comparison charts use one row per segment with a column per year. Paste or import a CSV.
| Step | Value |
|---|---|
| FY23 | 8.4 |
| New business | 3.1 |
| Churn | -1.2 |
Step by step
How to make one
Drop your numbers in, or import a CSV.
Choose the chart, theme and animation speed.
Tune colours, labels and add your brand.
Download MP4, GIF, PNG or SVG.
Best practices
Get it right
- ✓Keep one consistent style across the report.
- ✓Use a waterfall to explain what moved the number.
- ✓Export SVG or high-res PNG for print.
- ✓Label years and units clearly.
- ✕Mix chart styles section to section.
- ✕Show only the end number without the bridge.
- ✕Use low-resolution exports in a print PDF.
- ✕Truncate axes on a year-over-year comparison.
Watch out
Common mistakes to avoid
If every chart looks different, the report reads as assembled from scraps. Lock one style and apply it throughout.
A headline figure with no bridge leaves readers guessing what drove it. A waterfall answers the question.
A blurry chart in a printed report undercuts everything. Export SVG or high-resolution PNG.
A year-over-year comparison with a truncated axis misleads and, once noticed, taints the whole report.
Why Reochart
Built for sharing, not just charting
- ✓No design skills required
- ✓Animated MP4 and GIF exports
- ✓PNG and scalable SVG too
- ✓Your brand colours and logo (Pro)
- ✓Paste from a sheet or import a CSV
- ✓Presentation and feed ready in minutes
FAQ
Frequently asked questions
What charts belong in an annual report?
An annual report calls for charts that carry a full year in a form a reader can absorb once and trust. Year-over-year comparison bars do most of the work, since the central question is how this year compared with last. A waterfall or bridge chart explains what moved a headline figure, breaking a change in revenue or profit into the gains and losses that produced it, which is far more informative than the net number. A donut or stacked bar shows composition, revenue by segment or spend by category, and a counter gives one milestone figure a whole frame. The production constraint is that annual reports are often printed, so charts need to survive without colour distinctions alone and export as print-resolution PNG or scalable SVG rather than screen-resolution images.
What charts go in an annual report?
Comparison bars for year-over-year, a waterfall to bridge what changed, a donut or stacked bar for composition, and a counter for the headline figure.
How do I show what changed over the year?
A waterfall (bridge) chart starts at last year's number, steps through each gain and loss, and lands on this year's — the clearest way to explain the movement.
What format is best for a printed report?
SVG or high-resolution PNG. Vector SVG stays crisp at any print size; for raster, export the highest-resolution PNG available.
Can I keep every chart on-brand?
Yes. On Pro you set brand colours and add your logo, and using one style across the report makes it read as a single authored document.
Can I make it animated?
Yes. Charts animate by default, and you can export the animation as an MP4 or GIF, or grab a static PNG or SVG if you prefer.
Is Reochart free?
Yes. The free plan lets you make every chart type except the animated bar chart race, and export an animated MP4 with a small watermark, no card needed. Pro adds the bar chart race, removes the watermark, and adds GIF and SVG, your brand colours and logo, longer videos and CSV import.
Keep exploring
Related generators
From the blog
Learn more about charts and data storytelling

11 min read
How to Create an Animated Number Counter
A step-by-step guide to building a number counter that actually lands: picking the number worth this treatment, setting an honest start point, adding the context that makes it mean something, and exporting an animated version for a launch post, a deck, or a milestone update.
Read article →

11 min read
How to Build a QBR Dashboard
A practical guide to building the handful of charts a quarterly business review actually needs: the growth number, the bridge that explains it, the pipeline read, the KPI scorecard, and the roadmap for what's next.
Read article →