Social Media Chart Maker
Make charts built to stop the scroll — animated, square or vertical, ready to post. Export MP4, GIF, PNG or SVG.
Free to try · No design skills · Ready in about two minutes
Trusted by 1,220 users, including people at
 ByteDance
 Arizona State
 Fox
Fox UT Austin
 Roche
Roche Tulane
 United Airlines
 Clemson
 NHS
NHS Ayming
 Marquette
 Kent State
 Ray White
 UC Riverside
 CBA
CBA Illinois Tech
 Venngage
 Hofstra
 House of Communication
 IIT Madras
 Sotherly Hotels
 Zenus.ai
Overview
What this tool is for
A chart on social media is fighting for a fraction of a second of attention against video, memes and everything else in the feed. A static, default chart loses that fight. What works is motion — a number that counts up, bars that grow, a line that draws itself — paired with a single, instantly-legible point and a format sized for the platform.
Each platform has its shape: square (1:1) and vertical (4:5, 9:16) posts dominate mobile feeds, and native video (MP4) autoplays where a link preview would be ignored. The winning social chart is one idea, big and bold, animated, in the right aspect ratio, with text large enough to read on a phone held at arm's length.
Reochart makes charts built for exactly this: pick a format, animate it, and export a native MP4 or GIF that loops in the feed, or a crisp PNG for a carousel. Turn a milestone, a result or a comparison into a few seconds of motion people actually stop for, without opening a video editor.
How it works
How to make social media charts
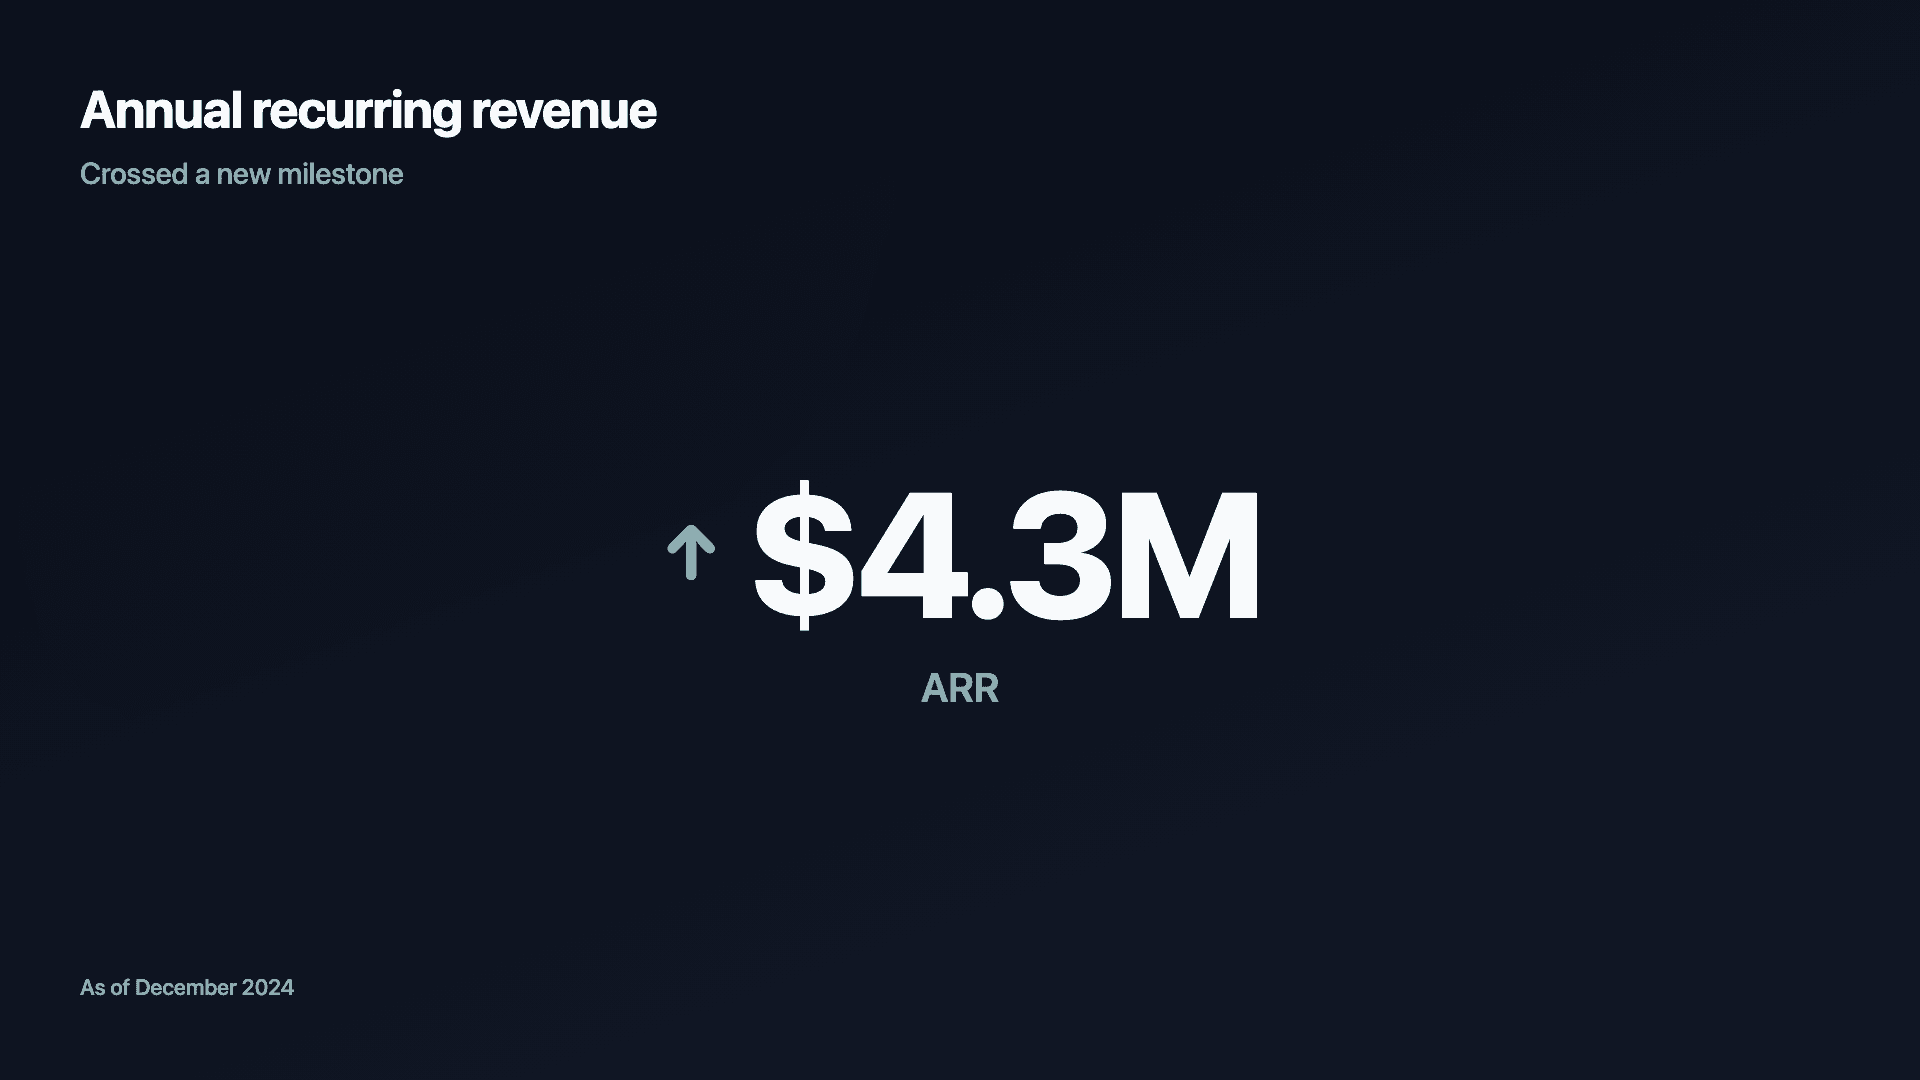
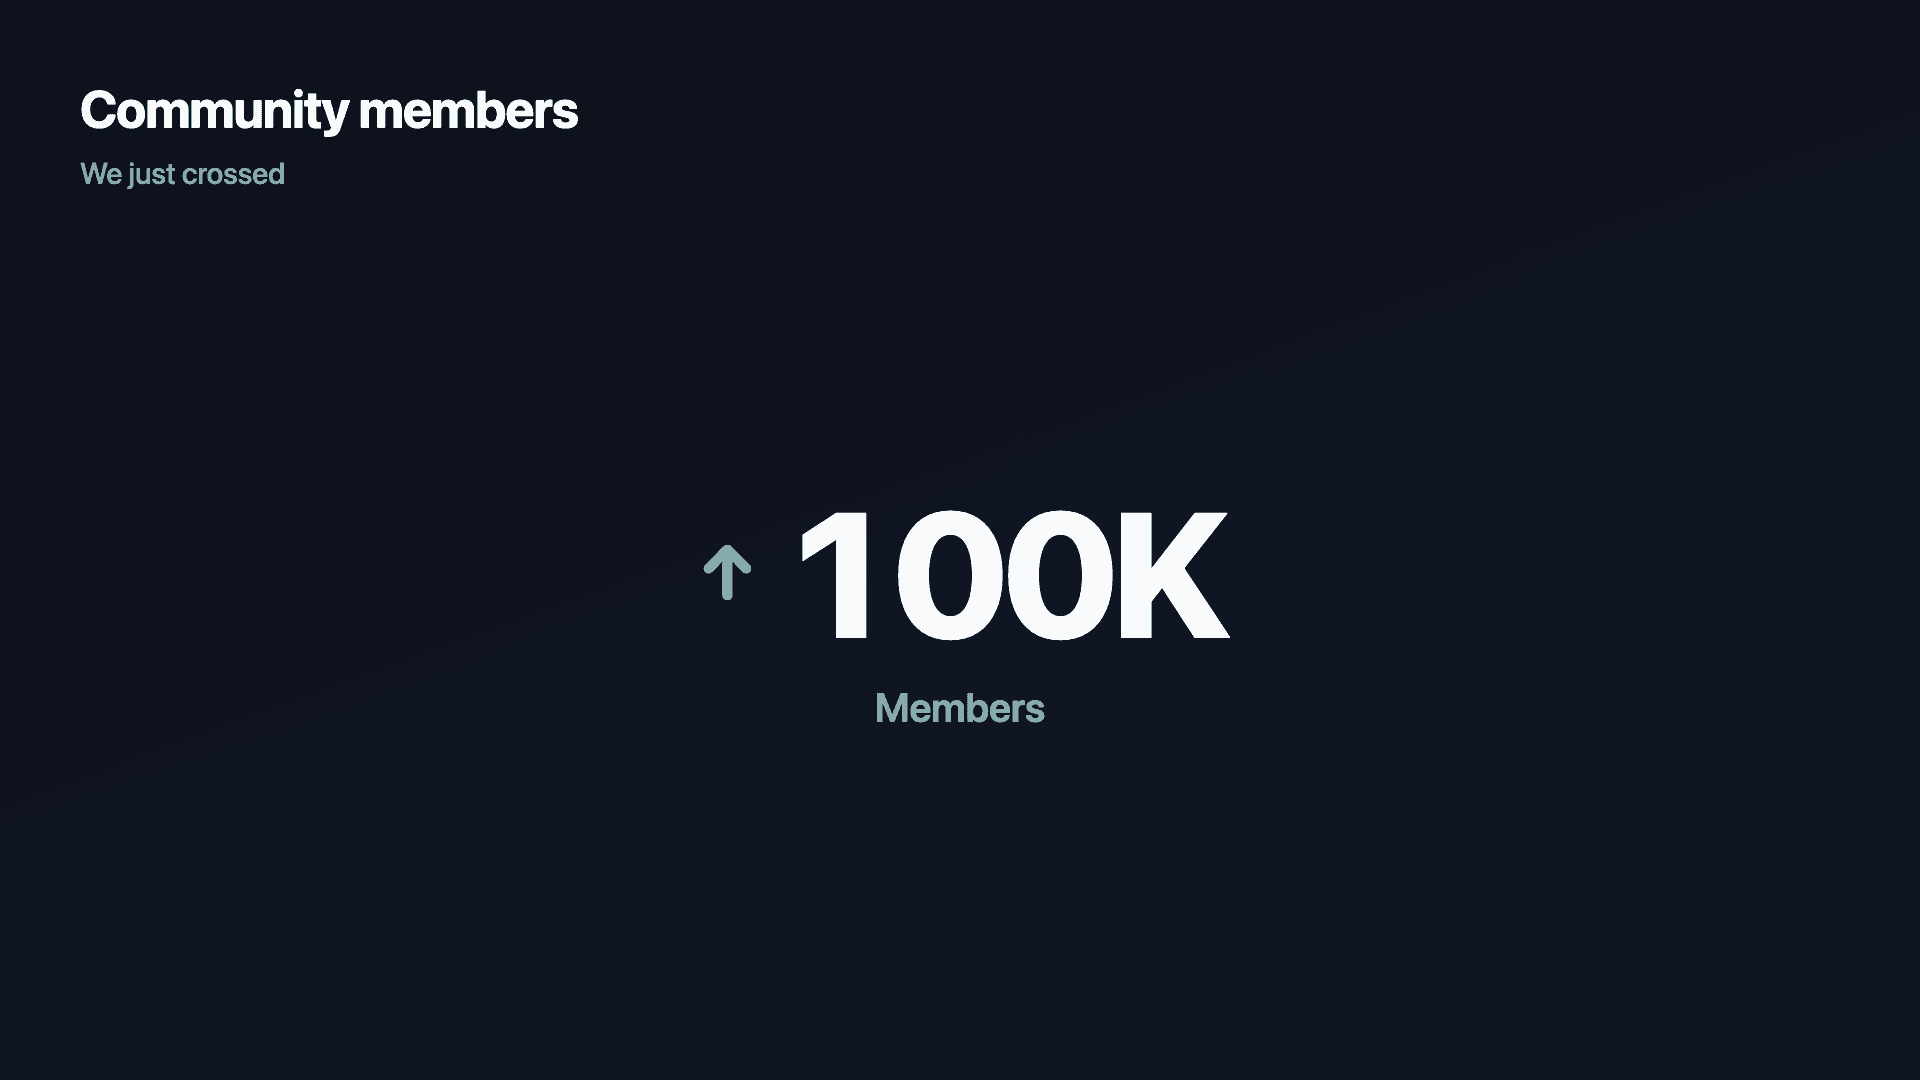
Pick the one point worth posting and a punchy chart: a counter for a milestone, bars for a comparison, a line for a growth story. Choose the aspect ratio for the platform (square or vertical for feeds), set big bold text and your brand colours, and turn animation on.
Export a native MP4 for autoplay in the feed, or a GIF for quick shares in chat and comments. Keep the animation short — three to six seconds loops well — and put the takeaway in the caption too, for anyone with motion turned off.
Examples
Example charts
Real charts made in Reochart, each with its own data and theme. They animate automatically as you scroll.
Good fit
When to use it
- ✓A milestone or result worth celebrating
- ✓Data points in a LinkedIn or X post
- ✓Instagram and TikTok feed posts
- ✓Carousel slides
- ✓Short-form video intros and outros
Reach for something else
When not to use it
- ✕The story needs nuance, a chart oversimplifies for a caption.
- ✕Data is sensitive or unverified, a post is permanent and public.
- ✕You have many metrics, pick one; a feed is no place for a dashboard.
- ✕The platform is text-first, sometimes the number in words wins.
Compare
Which chart to use
Which chart for a social post.
| Goal | Best chart | Why |
|---|---|---|
| Celebrate a milestone | Counter | One number, counting up |
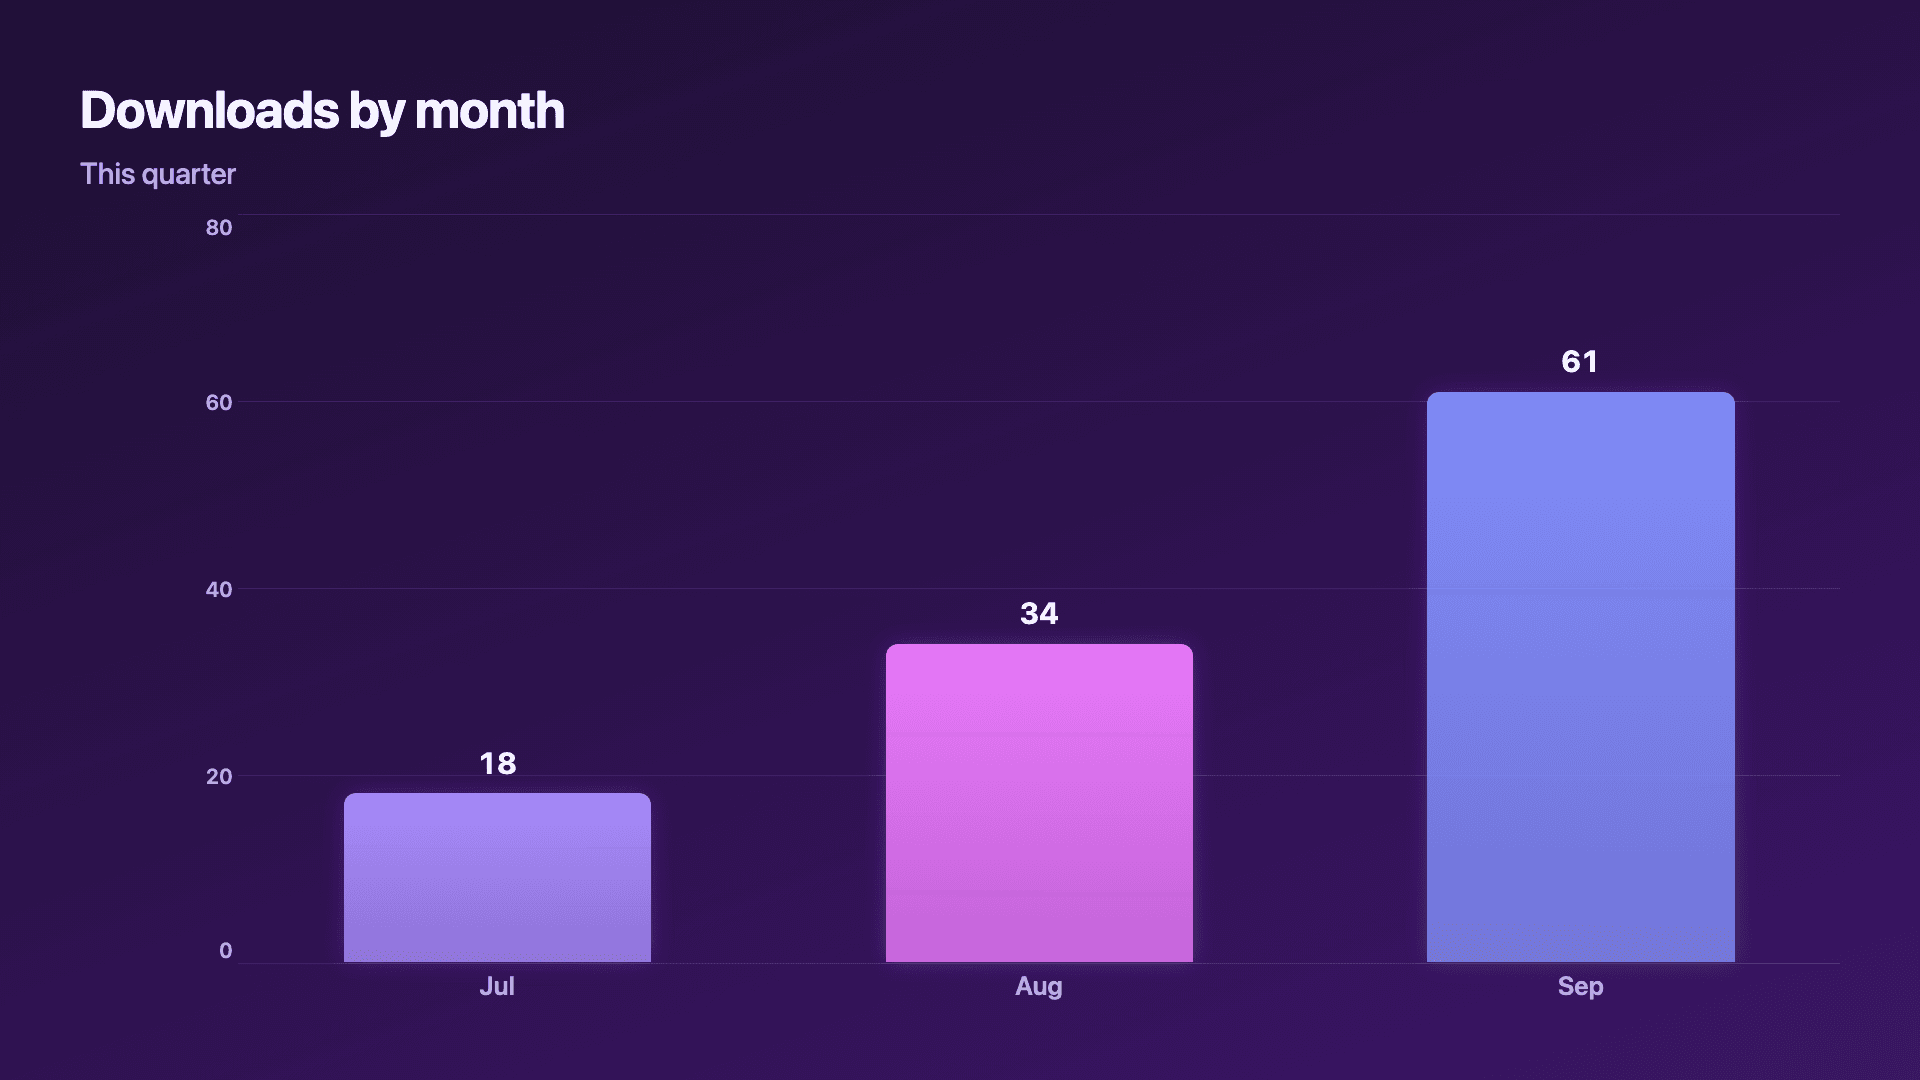
| Compare a few values | Bar | Grows in, reads instantly |
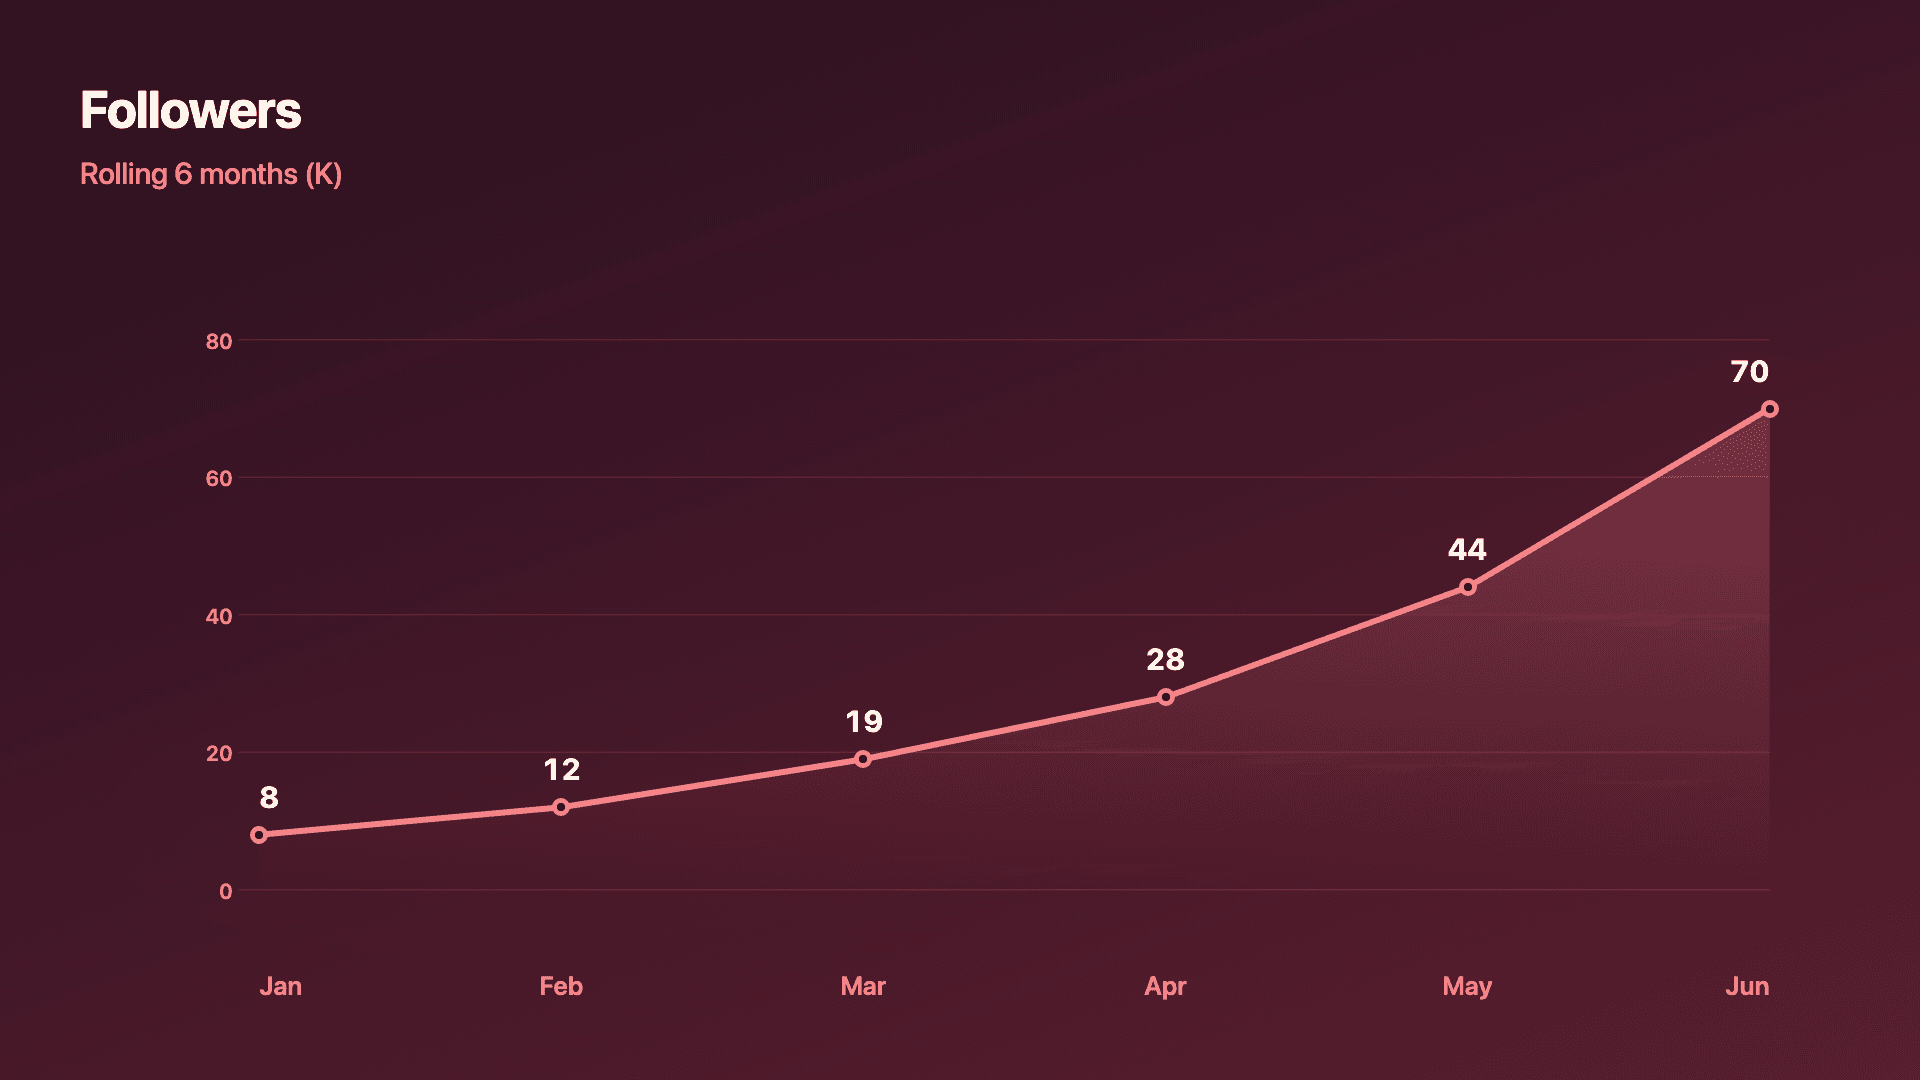
| Show momentum | Line or area | A curve that draws on |
| Ranking over time | Bar chart race | Built for feed motion |
Your data
What data you need
Social charts are usually one number (counter) or a few label-and-value rows. Pick a square or vertical format for feeds. Paste or import a CSV.
| Label | Value |
|---|---|
| Jul | 18 |
| Aug | 34 |
| Sep | 61 |
Step by step
How to make one
Drop your numbers in, or import a CSV.
Choose the chart, theme and animation speed.
Tune colours, labels and add your brand.
Download MP4, GIF, PNG or SVG.
Best practices
Get it right
- ✓Animate it — motion stops the scroll.
- ✓Use a square or vertical format for mobile feeds.
- ✓Make text big enough to read at a glance.
- ✓Put the takeaway in the caption too.
- ✕Post a static default chart into a moving feed.
- ✕Use a wide 16:9 chart in a vertical feed.
- ✕Cram multiple metrics into one post.
- ✕Rely on motion alone — some users mute autoplay.
Watch out
Common mistakes to avoid
A flat chart scrolls past unnoticed. Animation — a counter, growing bars, a drawing line — is what earns the stop.
A widescreen chart shrinks to a sliver in a vertical mobile feed. Export square or vertical for social.
Feeds are viewed on phones at arm's length. If the labels aren't big and bold, the point is lost.
One post, one idea. A grid of metrics belongs in a report, not a feed.
Why Reochart
Built for sharing, not just charting
- ✓No design skills required
- ✓Animated MP4 and GIF exports
- ✓PNG and scalable SVG too
- ✓Your brand colours and logo (Pro)
- ✓Paste from a sheet or import a CSV
- ✓Presentation and feed ready in minutes
FAQ
Frequently asked questions
What makes a good social media chart?
A social media chart succeeds or fails in about two seconds, on a phone, with the sound off, against everything else in the feed. That rules out most conventional chart design. Motion does the initial work, because movement stops a scroll before any content has had a chance to earn attention, which is why a native MP4 or GIF consistently outperforms a static image. Text has to be large enough to read at thumbnail size, and the chart has to make exactly one point, since a reader who has to work out what they are looking at has already scrolled. Aspect ratio matters more than it does anywhere else: square or vertical formats occupy more of a mobile screen than landscape, and a three to six second clip loops cleanly without feeling slow.
What makes a good social media chart?
Motion, one clear point, big bold text, and the right aspect ratio for the platform. An animated counter or growing bars stops the scroll where a static chart doesn't.
What format should I post?
A native MP4 for autoplay in the feed, or a GIF for chats and comments. Export square (1:1) or vertical (4:5, 9:16) for mobile feeds, and a PNG for carousels.
How long should the animation be?
Short — about three to six seconds — so it loops cleanly in the feed without dragging. Reochart's clips are built for this.
Is this different from the LinkedIn chart maker?
It's the same engine tuned for social generally — Instagram, X, TikTok and more — with square and vertical formats. The LinkedIn page focuses on that platform specifically.
Can I make it animated?
Yes. Charts animate by default, and you can export the animation as an MP4 or GIF, or grab a static PNG or SVG if you prefer.
Is Reochart free?
Yes. The free plan lets you make every chart type except the animated bar chart race, and export an animated MP4 with a small watermark, no card needed. Pro adds the bar chart race, removes the watermark, and adds GIF and SVG, your brand colours and logo, longer videos and CSV import.
Keep exploring
Related generators
From the blog
Learn more about charts and data storytelling

11 min read
How to Create an Animated Number Counter
A step-by-step guide to building a number counter that actually lands: picking the number worth this treatment, setting an honest start point, adding the context that makes it mean something, and exporting an animated version for a launch post, a deck, or a milestone update.
Read article →

11 min read
How to Build a QBR Dashboard
A practical guide to building the handful of charts a quarterly business review actually needs: the growth number, the bridge that explains it, the pipeline read, the KPI scorecard, and the roadmap for what's next.
Read article →